
Deploy an on-premise data hub with Canonical MAAS, Spark, Kubernetes and Ceph

robgibbon
on 14 May 2024

In this post we’ll explore deploying a fully operational, on-premise data hub using Canonical’s data centre and cloud automation solutions MAAS (Metal as a Service) and Juju.
MAAS is the industry standard open source solution for provisioning and managing physical servers in the data centre. With the rich featureset of MAAS, you can build a bare-metal cloud for any purpose. This time we’ll use MAAS to deploy a data hub for big data storage and distributed, parallel processing with Charmed Spark – Canonical’s solution for Apache Spark. Spark has become the de-facto solution for big data processing these days.
Juju is Canonical’s take on cloud orchestration. Juju orchestrates “Charms”, which are software operators that help you to handle deployment, configuration and operation of complex distributed infrastructure and platform software stacks. Juju works with both Virtual Machines and Kubernetes so that you can build up complex service architectures in a flexible manner. Juju Charms are available for many different purposes – from cloud building through to Kubernetes, distributed databases and beyond to AI/MLOps.
Sometimes the cloud just doesn’t cut it. For whatever reason you want to deploy your data hub on premise – this could be because of the scale of the service, or cost, the sensitivity of the data being processed, or simply a matter of company policy. MAAS makes it straightforward to manage data centre systems at scale, and with Juju we can orchestrate those systems and the software applications that they run in sophisticated ways.
The solution we’ll deploy will look like this:
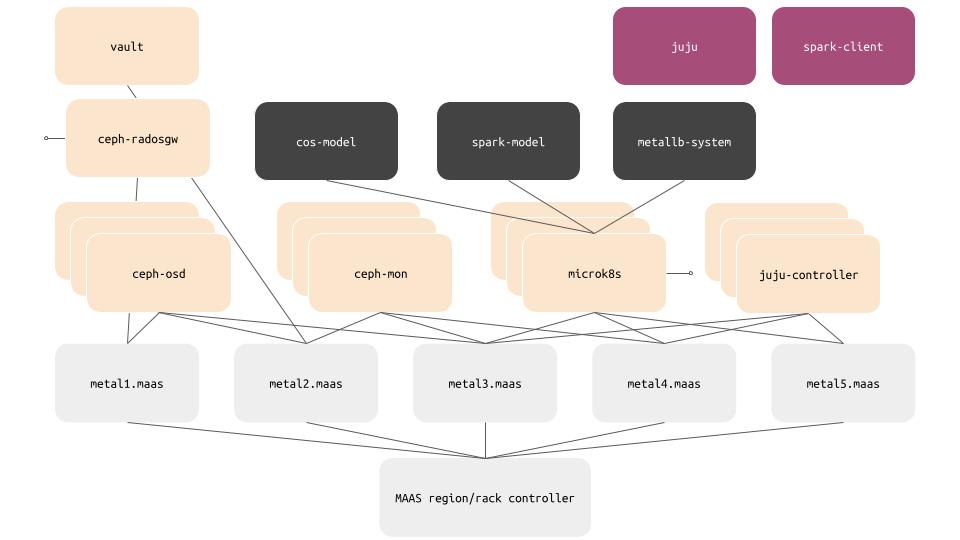
Metal head
We’ll first deploy MAAS and get it to PXE boot some physical servers. For the physical servers, I’ve used five Lenovo ThinkCenter computers that I bought refurbished from Amazon, although you could use any suitable x86_64 hardware that you have available. I found that ThinkCenters offer a relatively low cost approach to building a home lab. Although they vary in price, I picked them up for about $200 per system plus tax which gives me 16GB of RAM, 4 CPU cores and 250GB of storage per system – enough for a home lab and for this post.
I installed MAAS on my Ubuntu 22.04 LTS laptop, so my laptop acts as the controller for the home lab.
To get started, we’ll run the following commands to install MAAS. We’ll also install a specially preconfigured test PostgreSQL database for MAAS, to make home lab configuration a bit easier. For production, you’d want a dedicated external PostgreSQL database cluster.
sudo snap install maas
sudo snap install maas-test-db
The next step is to initialise and configure MAAS so that we can log in to its Web UI.
sudo maas init region+rack --database-uri maas-test-db:///
MAAS URL [default=http://192.168.86.45:5240/MAAS]:
When you’ve entered a suitable URL, or accepted the default, the following prompt will appear:
MAAS has been set up.

If you want to configure external authentication or use
MAAS with Canonical RBAC, please run

  sudo maas configauth

To create admins when not using external authentication, run

  sudo maas createadmin
Let’s go ahead and create that admin account so we can proceed. It’s important to import your SSH public keys from GitHub (gh) or LaunchPad (lp) as MAAS will need these to be able to grant you SSH access to the systems that it deploys. Note as well that MAAS configures the SSH user to be ubuntu.
sudo maas createadmin
Username: yourusername
Password: ******
Again: ******
Email: yourusername@example.com
Import SSH keys [] (lp:user-id or gh:user-id): gh:yourusername
There’s one final step: we’ll want an API key so that we can orchestrate MAAS actions with Juju. Let’s make one now for our MAAS user account that we just created.
sudo maas apikey --username yourusernameEnable TLS on MAAS
Let’s set up some wire encryption for our services, starting by generating a root CA certificate and server certificate for the MAAS API and Web UI.
MAAS_IP=192.168.86.45
sudo apt install mkcert -y

mkcert -install
mkcert maas.datahub.demo ${MAAS_IP}
cp ${HOME}/.local/share/mkcert/rootCA.pem .
Next, we’ll enable TLS on our MAAS region and rack controller.
sudo cp rootCA.pem /var/snap/maas/common
sudo cp maas.datahub.demo+1.pem /var/snap/maas/common
sudo cp maas.datahub.demo+1-key.pem /var/snap/maas/common

echo "y" | sudo maas config-tls enable --port 5443 --cacert /var/snap/maas/common/rootCA.pem /var/snap/maas/common/maas.datahub.demo+1-key.pem /var/snap/maas/common/maas.datahub.demo+1.pem
Now we should be able to log into the MAAS web UI and start adding our host systems to the MAAS inventory. You’ll need to step past the security warning, as this is a self-signed certificate. Obviously for production use you should use a real CA (Certificate Authority) – whether a third party like Let’s Encrypt or a CA that your organisation manages.
Once you’ve logged in with the username and password you just created, you’ll need to perform some further configuration steps to get MAAS working like it should.
- Under “Networking”, go to “Subnets”.
- Find the network where you will be adding your servers. For example, my network is 192.168.86.0/24. Click on the VLAN link to the left of this network. The link is likely titled “untagged”.
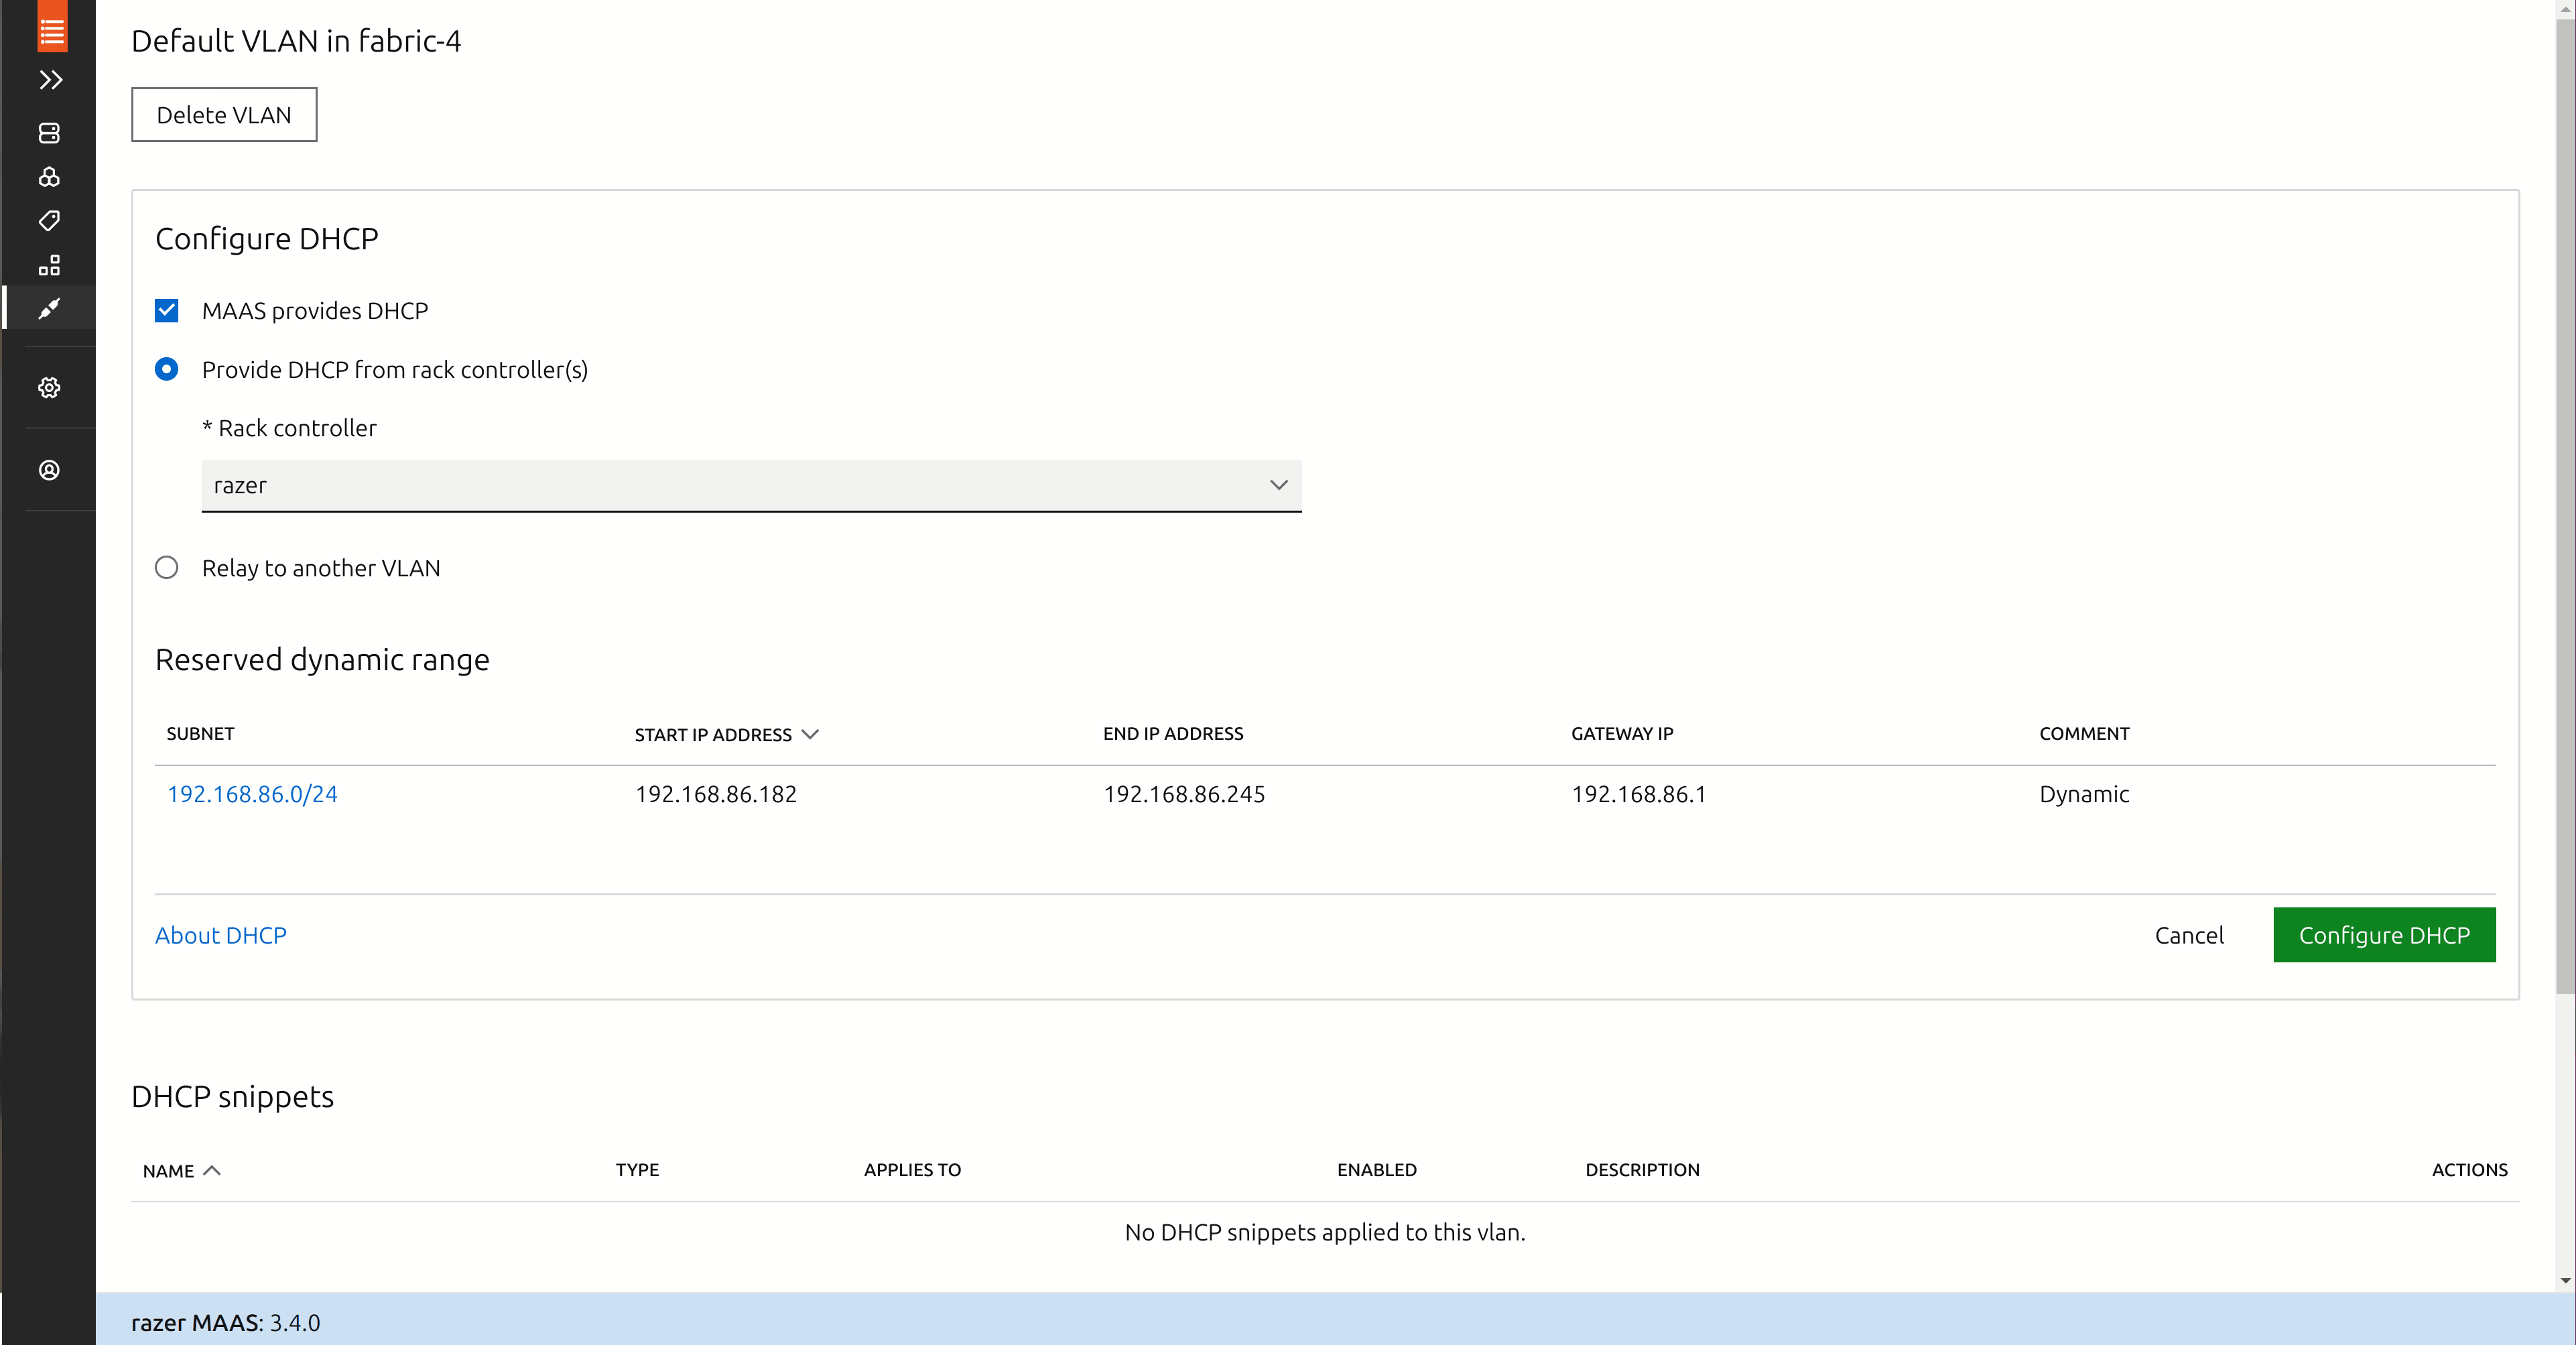
- Find and click the button “Configure DHCP”.
- Leave the checkbox “MAAS provides DHCP” checked.
- Choose “Provide DHCP from rack controller(s)”.
- Click the dropdown list entitled “Select subnet…” and choose the available subnet
- Choose sensible values for start IP address and end IP address, and set the gateway IP address to your network’s gateway IP address.
- Click the button “Configure DHCP”.
While we’re here, let’s reserve a small range of IP addresses that MAAS won’t touch, that we can use for the MetalLB Kubernetes load balancer and also for the Ceph Rados Gateway which we’ll deploy later on.
- Again under “Networking”, “Subnets”.
- Find the network where you will be adding your servers. For example, my network is 192.168.86.0/24. Click on the VLAN link to the left of this network. The link is likely entitled “untagged”.
- Find and click the button “Reserve Range”.
- Click “Reserve Range” from the dropdown menu.
- Take a small range of five IP addresses from within the subnet – I took a start IP of 192.168.86.90 and an end IP of 192.168.86.95
- Click “Reserve”.
- Repeat the process for the Ceph Rados Gateway, this time take just a single IP address for both start and end addresses – I took 192.168.86.180
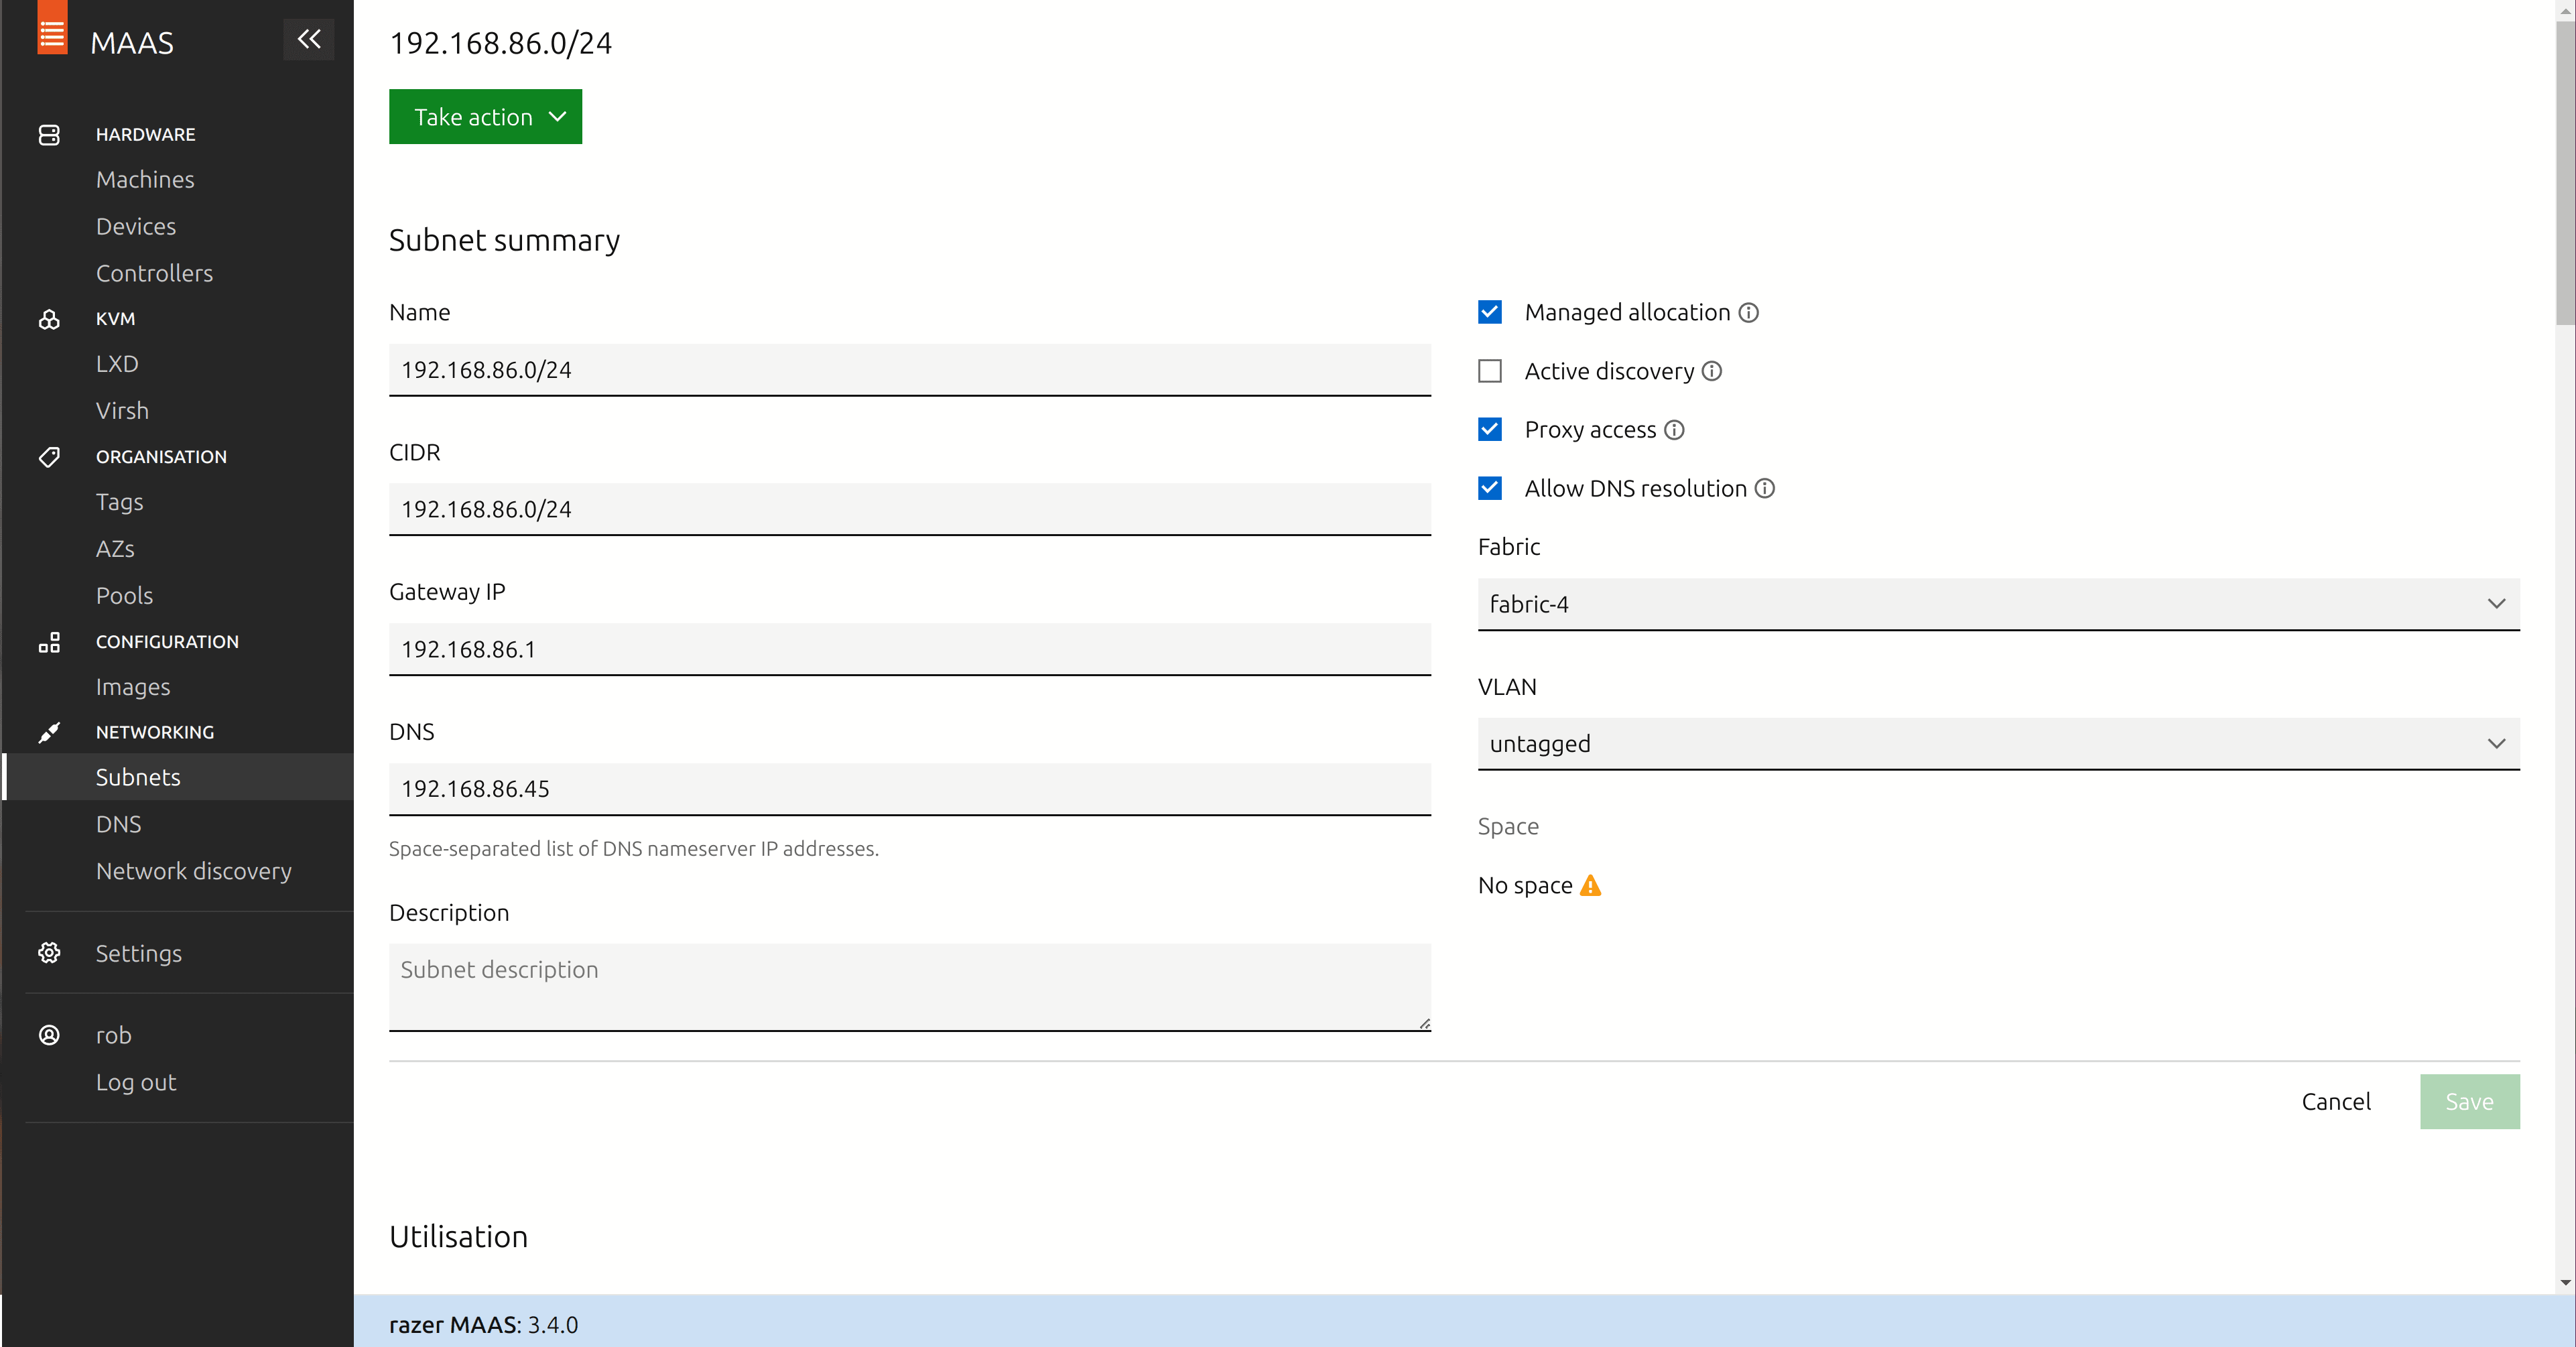
Now, back on the Subnets screen, click on the IP address of your main network.
- Click the button “Edit”.
- In the box labelled “DNS”, add the IP address of your MAAS host – in my case that’s the IP address of my laptop.
- Click “Save”.
Ok, so we’ve configured the minimal networking requirements to get MAAS working. Of course, you can go much, much further with MAAS in a data centre environment with sophisticated VLAN, zone, hall and site configurations. But this will be just enough for our home lab and to build our data hub.
Now that those steps are done, we can start enlisting machines. To enlist a machine, you’ll first need to perform the following preparatory steps.
On the target machine:
- Enter the system BIOS of the machine. In the boot sequence menu, enable network (PXE) booting and make this the first item in the boot order. You might also need to enable PXE IPv4 stack in the networking menu, depending on your BIOS.
- While you’re here, check that the CPU has virtualization extensions enabled and if not, enable them as we’ll need this later.
- Save your BIOS configuration changes.
On the MAAS host:
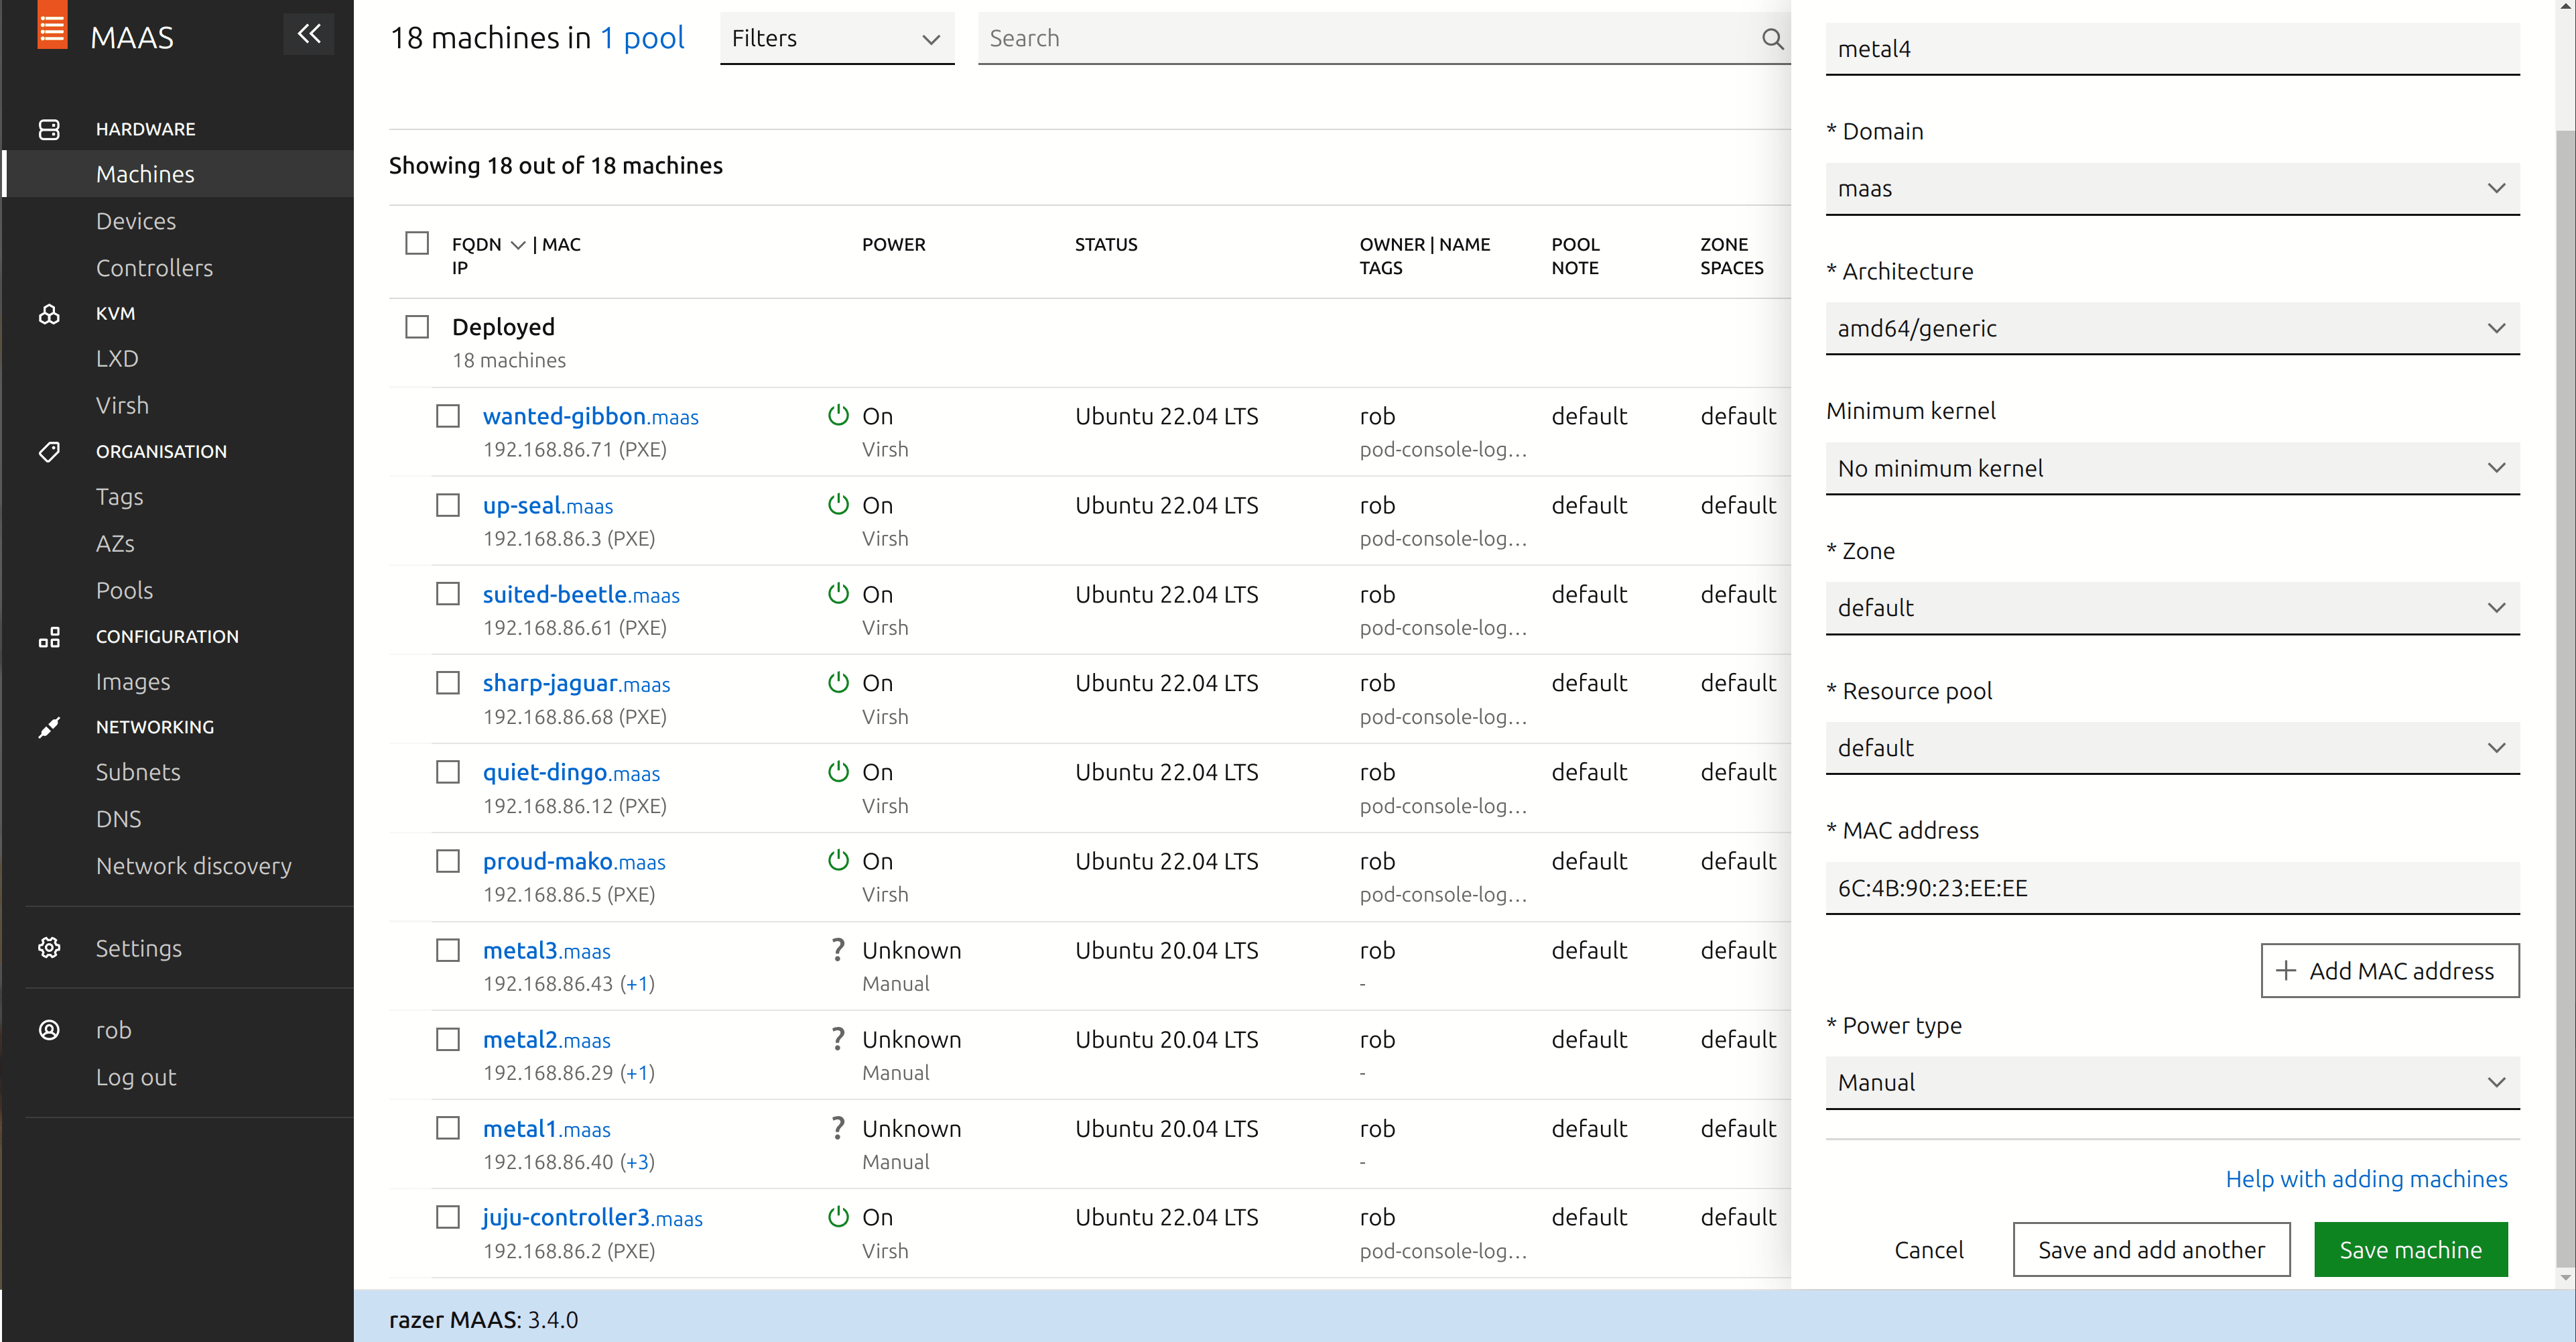
- In the MAAS UI, under Hardware, go to Machines and choose “Add Hardware” from the menu in the top right of the screen. From the dropdown menu, choose “Machine”.
- Give your system a name, for instance metal1.
- Enter the MAC address of your system’s network adapter. You should be able to find this in the BIOS or otherwise your system may display it on the screen at boot time.
- In the “Power Type” dropdown, choose “Manual”.
- Click “Save Machine”.
Now go back to your target machine, exit the BIOS configuration screen and reboot.
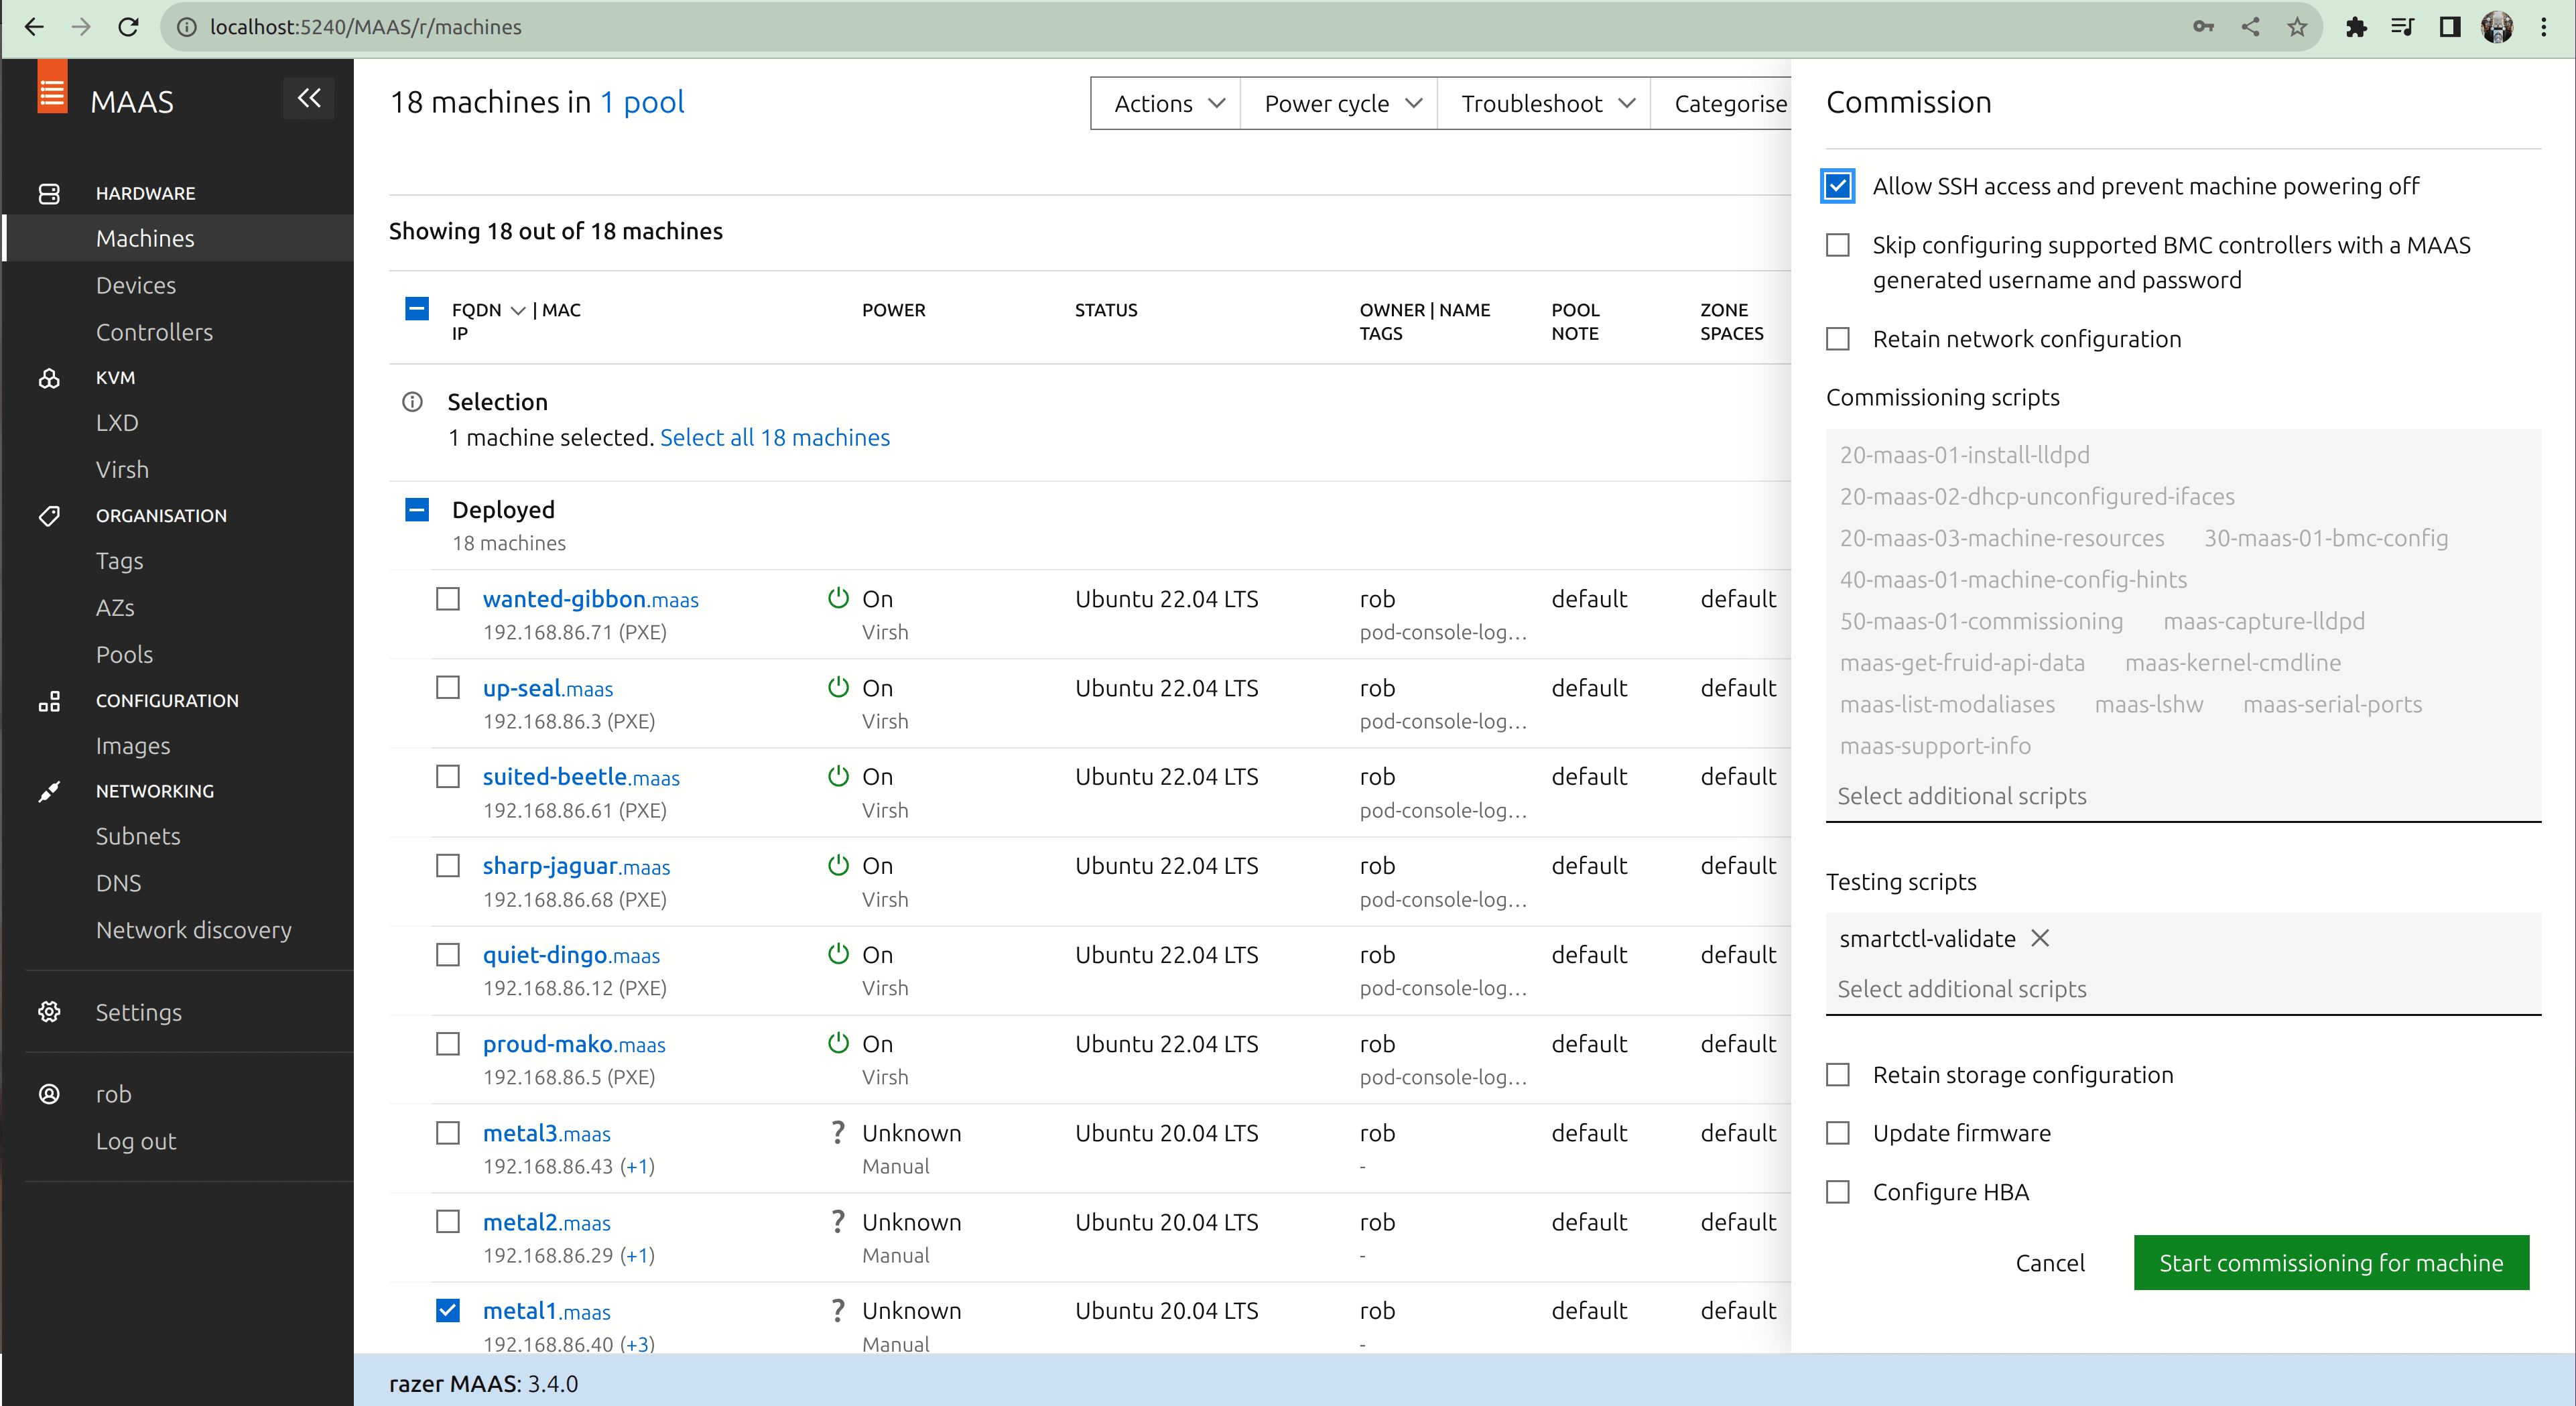
At this point, the system should enter PXE boot mode and initiate a network boot from MAAS. The system should also show up in the MAAS machine inventory, in the state “Commissioning”. After a while, the machine will provision and shut itself down. To prevent the machine shutting down all the time and to gain SSH access, we’ll commission it again, by performing the following steps.
- Check the checkbox next to the system in the “Machines” screen.
- In the dropdown menu labelled “Actions”, choose “Commission…”.
- Check the checkbox labelled “Allow SSH access and prevent machine powering off”.
- Click the button “Start commissioning for this machine”.
You’ll need to power the machine on manually, and at this point it should start reprovisioning. Note that in a real data centre, power cycling the machine is usually done through remote management agents, which MAAS can fully support. Once completed, the machine should be marked “Available” in the “Machines” screen.
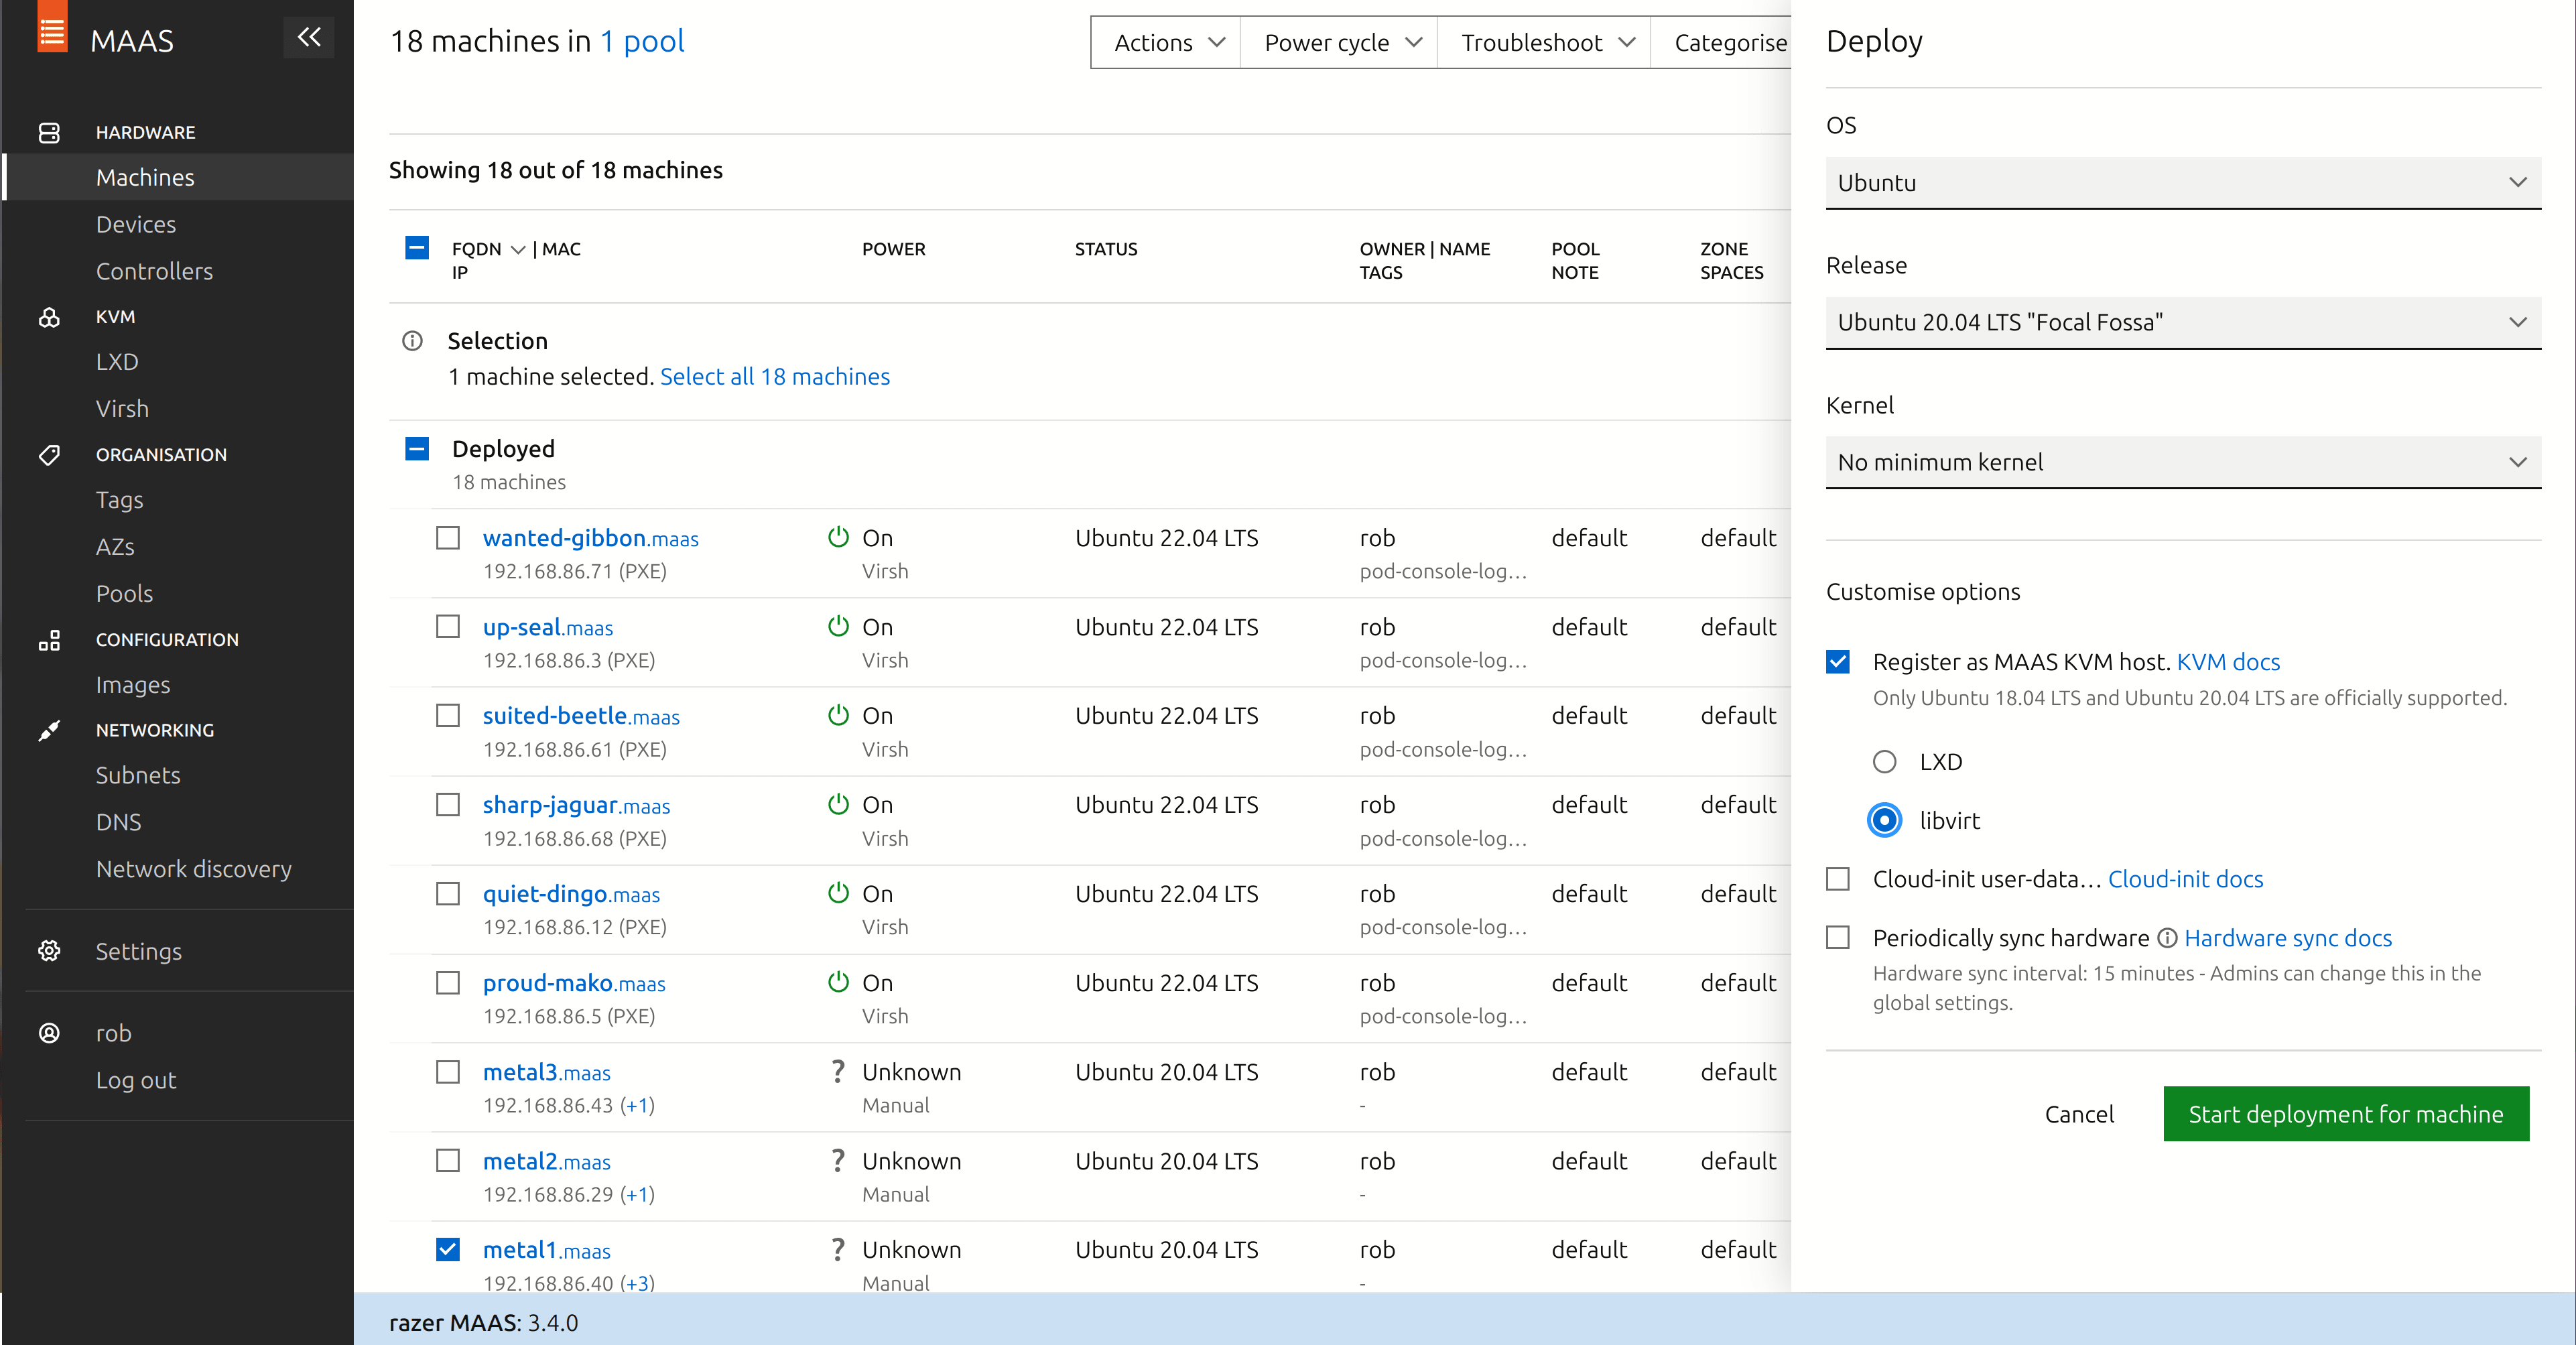
Next we’ll want to move the system to “deployed” state.
- Again, check the checkbox next to the system in the “Machines” screen.
- In the dropdown menu labelled “Actions”, choose “Deploy…”.
- Check the checkbox labelled “Register as MAAS KVM host”.
- You can choose either “LXD” or “libvirt” here – I chose libvirt for my systems.
- Click the button “Start deployment for machine”.
You’ll need to power cycle the machine manually again, and at this point it should start installing Ubuntu Server on the system. Once completed, the machine should be marked “Deployed” in the “Machines” screen.
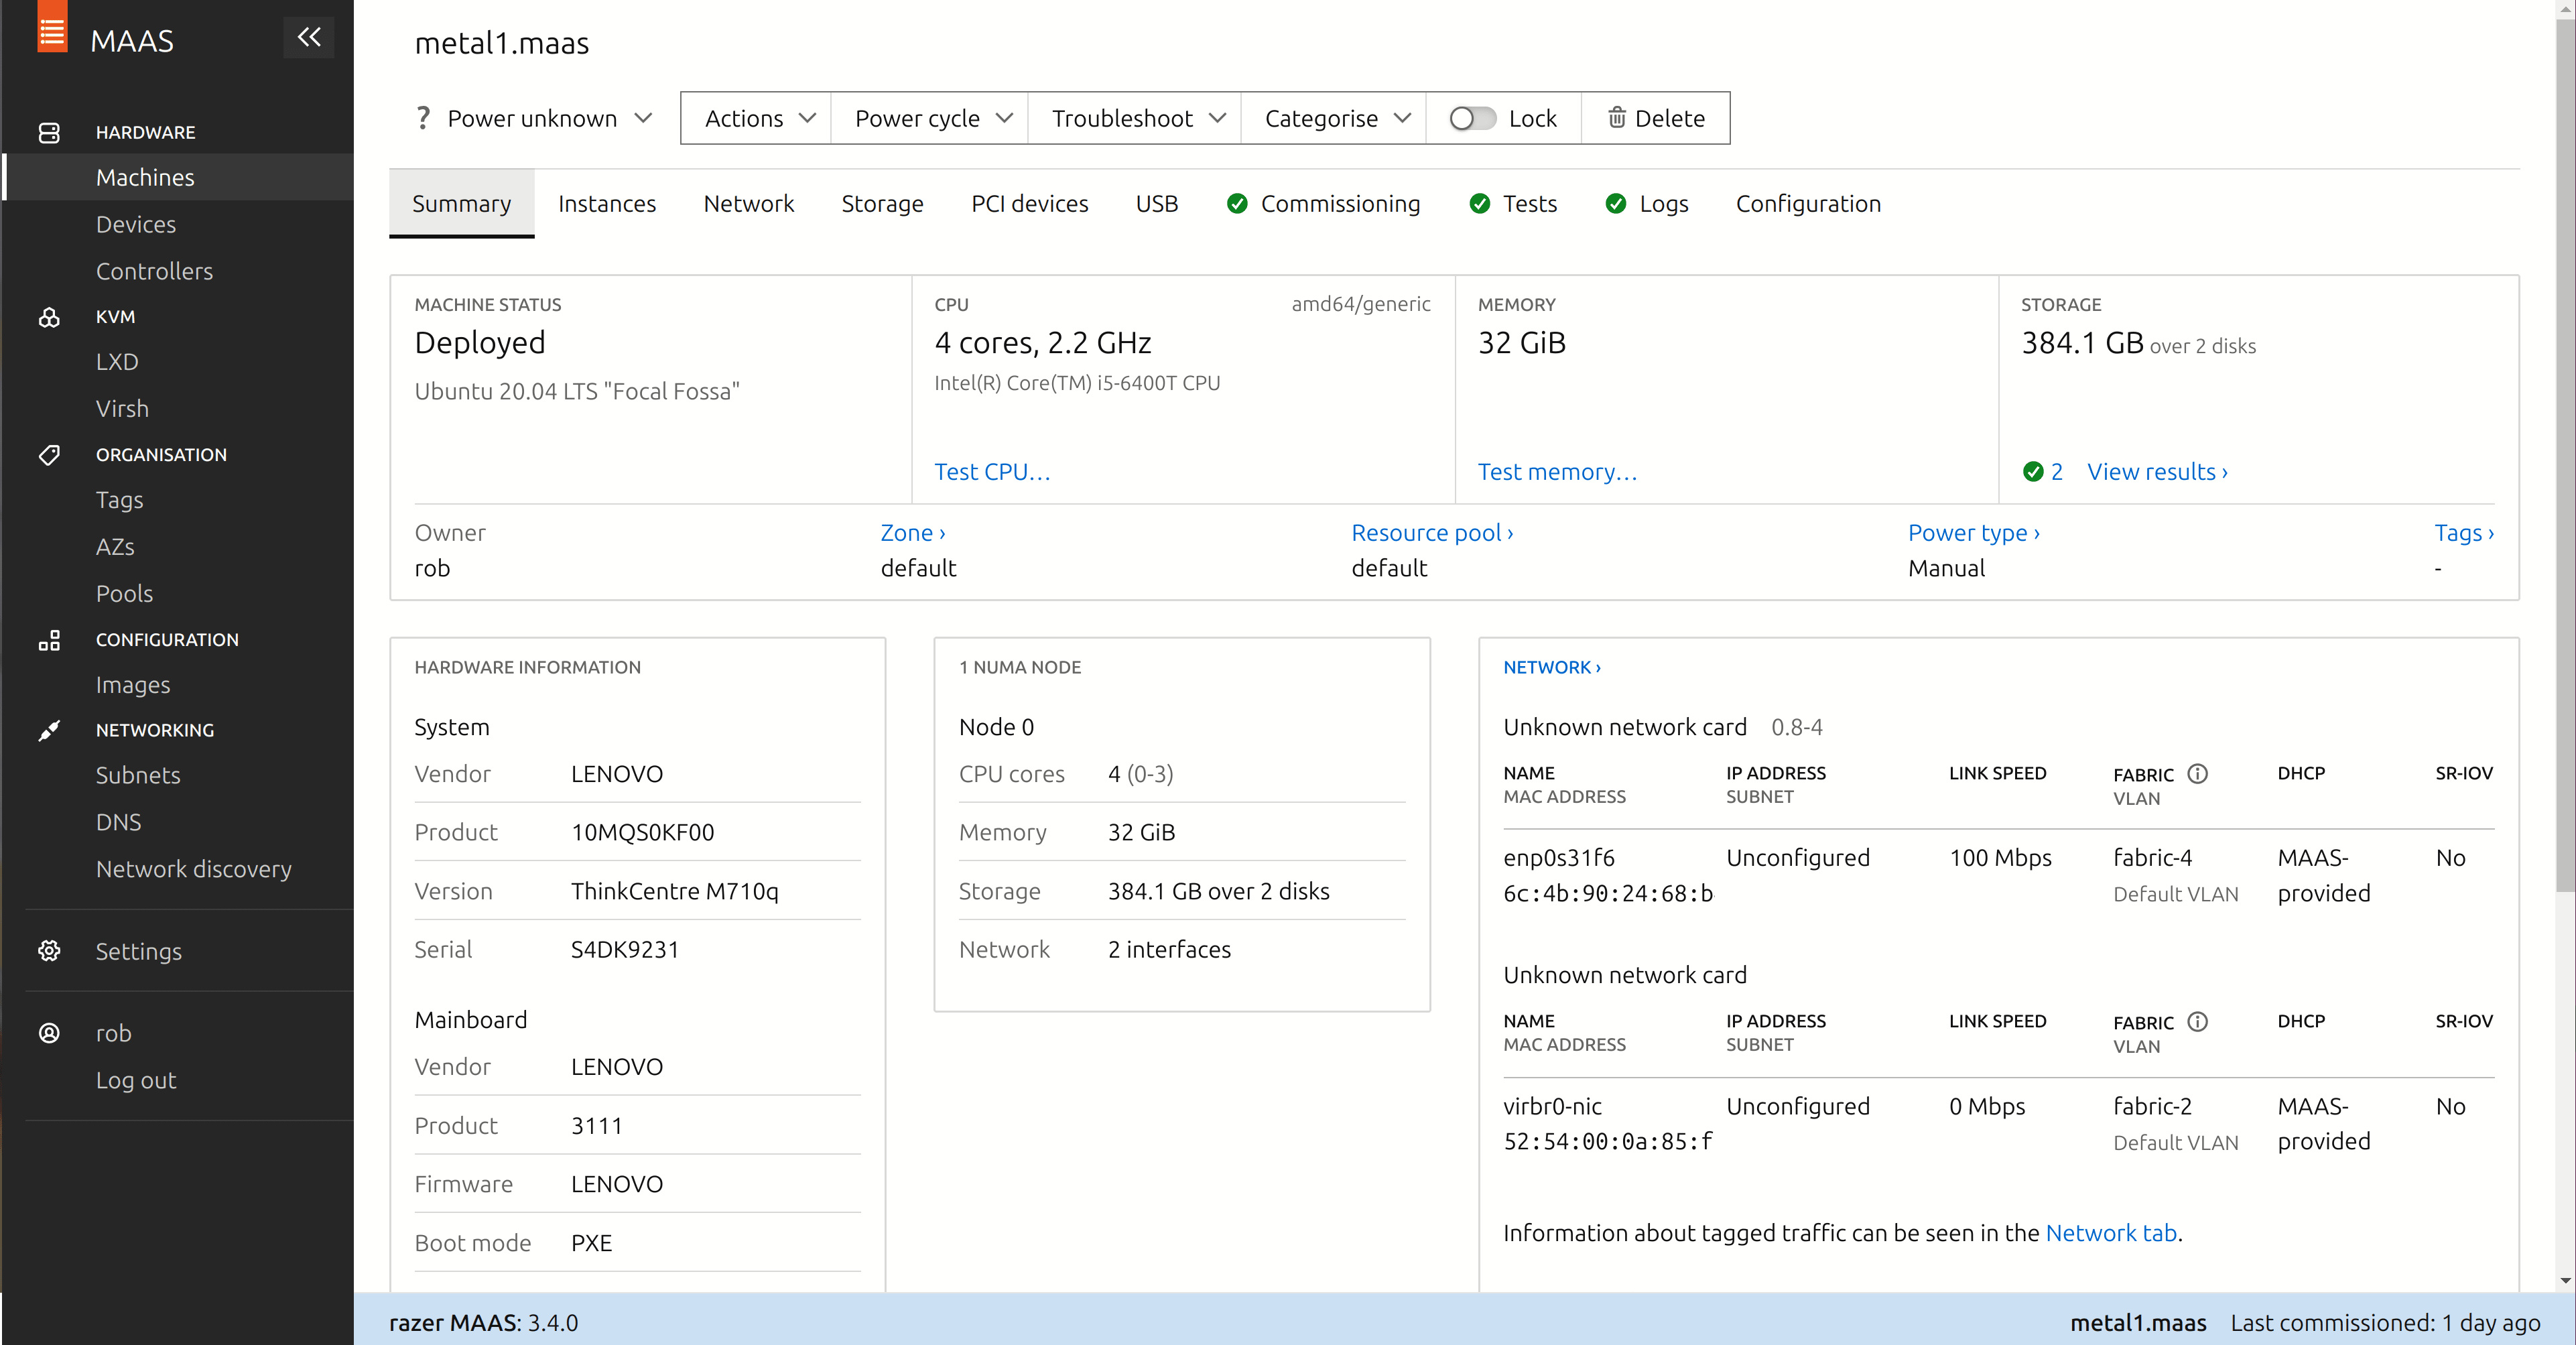
That’s all that we need to do to have the system deployed and operational for our purposes. Repeat the process for the other systems that you’ll be using to build the data hub.
Back to black (and green)
Now that we have some physical hosts to build our data hub on, our next step is going to be to deploy the foundational services, which we’ll do at the command line. The foundation platform services we’ll deploy are:
- Juju controllers for orchestration,
- a Ceph object storage cluster based on Charmed Ceph,
- a Vault server,
- And a MicroK8s Kubernetes cluster.
We’ll deploy those foundational platform services into VMs running on top of our physical host systems, using Juju. Juju will create, configure, and manage the VMs and the software which runs on them, which will be PXE boot provisioned over the network by MAAS.
Get your Juju on
First, let’s install and configure Juju so that it knows how to work with our MAAS environment. You’ll need the MAAS API token that we made earlier, as well as the URL of your MAAS server. The following commands will:
- Install the Juju client on the local laptop.
- Register the MAAS environment with Juju.
- Install a three node cluster of Juju controllers on VMs on top of our MAAS environment to ensure Juju has high-availability.
MAAS_URL=https://192.168.86.45:5443/MAAS
MAAS_TOKEN=your-maas-api-token
MAAS_USER=your-maas-username

cat > maas-cloud.yaml <<EOF
clouds:
  maas:
    type: maas
    auth-types: [oauth1]
    endpoint: ${MAAS_URL}
    ca-certificates:
    - |
$(cat rootCA.pem | sed -e 's/^/      /')
EOF

cat > cloudinit-userdata.yaml <<EOF
cloudinit-userdata: |
  ca-certs:
    trusted:
    - |
$(cat rootCA.pem | sed -e 's/^/      /')
EOF

cat > maas-credential.yaml <<EOF
credentials:
  maas:
    ${MAAS_USER}:
      auth-type: oauth1
      maas-oauth: ${MAAS_TOKEN}
EOF

# Install the Juju client
sudo snap install juju --channel=3.3/stable
sudo snap install juju-wait --channel=latest/edge --classic

# Register the MAAS cloud
juju add-cloud --client maas -f maas-cloud.yaml
juju add-credential maas -f maas-credential.yaml --client

# Spin up a Juju controller cluster with HA
juju bootstrap maas --config caas-image-repo="public.ecr.aws/juju" \
     --credential ${MAAS_USER} \
     --model-default cloudinit-userdata.yaml cloud-controller
juju enable-ha
We’ve got the first bits down. Note that in this post, we’ll build our data platform with VMs running on top of the physical systems we provisioned, using LXD. But if you wanted, you could also build the data platform directly on bare metal systems by adding an inventory of physical systems using syntax similar to juju add-machine ssh:ubuntu@hostname. You can learn more about this command in the Juju operations guide.
Anyway, let’s set the password on our administrator account for the Juju controllers before we go any further. Run the command and enter your preferred password. You’ll need to enter it twice to confirm.
juju change-user-password adminJust so you know, you can always log in to Juju (for example from some other computer configured to manage the Juju controllers) using the following command.
juju login -u adminBuild up
Now that Juju is ready, we’ll build up the foundation components. First we’ll create a Juju “model” – which is like a namespace for resources. Then we’ll deploy a six node MicroK8s Kubernetes cluster into the model we created, and finally we’ll deploy a Ceph object storage cluster into the model. These commands will take a while to run to completion, so in the meantime go and make yourself a nice cup of tea. You can check on progress in a new terminal window by running juju status from time to time.
CEPH_VIP=192.168.86.180 # The IP we reserved in MAAS

juju add-model charm-stack-base-model maas

# Deploy Charmed MicroK8s
juju deploy microk8s -n 3 --config hostpath_storage=true --constraints "mem=8G root-disk=40G" --channel=edge; juju-wait
juju deploy microk8s microk8s-worker --channel edge --config role=worker --constraints "mem=8G root-disk=40G" -n 3
juju integrate microk8s:workers microk8s-worker:control-plane

juju expose microk8s

# Deploy Charmed Ceph with backend and S3 compatible API
juju deploy ceph-osd -n 3 --storage osd-devices=loop,1G,1; juju-wait
juju deploy -n 3 ceph-mon; juju-wait
juju deploy -n 3 ceph-radosgw --config vip=${CEPH_VIP}; juju-wait
juju deploy --config cluster_count=3 hacluster ceph-radosgw-hacluster; juju-wait

juju integrate ceph-radosgw-hacluster:ha ceph-radosgw:ha
juju integrate  ceph-radosgw:mon ceph-mon:radosgw
juju integrate  ceph-osd:mon ceph-mon:osd
juju-wait

juju expose ceph-radosgw
Lastly, we’ll deploy a Grafana agent component to enable us to monitor MicroK8s with COS (the Canonical Observability Stack), which we’ll deploy shortly.
juju deploy grafana-agent --channel edge; juju-wait
juju integrate microk8s:cos-agent grafana-agent
juju integrate microk8s-worker:cos-agent grafana-agent
The commands we just ran should be quite self-explanatory. Just a few details to note:
- juju deploy <thing> -n 3 means deploy 3 instances of the thing.
- When we deploy ceph-osd, we tell Juju to create one loopback storage device per node, with 1GB of capacity. This is good for testing but not suitable for a production data hub deployment. Ceph can handle many petabytes of storage, so obviously you can change this to reference physical block devices on the host. Learn more in the Charmed Ceph documentation.
Once the commands complete, you should have a working set of foundation services that will enable you to store and retrieve data through the AWS S3 object store API. You should also now have a platform to facilitate distributed, parallel processing of data, in the form of a Kubernetes cluster. Let’s proceed.
Deploy Vault
Now we’ll deploy Vault, to manage TLS on behalf of Ceph’s Rados Gateway API server.
# Install the Vault client
sudo snap install vault

# Deploy a Vault server
juju deploy vault --channel=1.8/stable; juju-wait
VAULT_IP=$(juju status | grep vault | tail -n 1 | awk '{ print $5 }')

# Configure TLS on Vault server API
mkcert vault.datahub.demo ${VAULT_IP}
juju config vault ssl-ca="$(cat rootCA.pem | base64)"
juju config vault ssl-cert="$(cat vault.datahub.demo+1.pem | base64)"
juju config vault ssl-key="$(cat vault.datahub.demo+1-key.pem | base64)"
juju-wait

# Initialise Vault
export VAULT_ADDR="https://${VAULT_IP}:8200"
VAULT_OUTPUT=$(vault operator init -key-shares=5 -key-threshold=3)
KEY1=$(echo ${VAULT_OUTPUT} | grep "Unseal Key 1" | awk '{ print $4}')
KEY2=$(echo ${VAULT_OUTPUT} | grep "Unseal Key 2" | awk '{ print $4}')
KEY3=$(echo ${VAULT_OUTPUT} | grep "Unseal Key 3" | awk '{ print $4}')
KEY4=$(echo ${VAULT_OUTPUT} | grep "Unseal Key 4" | awk '{ print $4}')
KEY5=$(echo ${VAULT_OUTPUT} | grep "Unseal Key 5" | awk '{ print $4}')
export VAULT_TOKEN=$(echo ${VAULT_OUTPUT} | grep "Initial Root Token" | awk '{ print $4 }')

echo "Do not lose these keys"
echo
echo "unseal key 1: ${KEY1}"
echo "unseal key 2: ${KEY2}"
echo "unseal key 3: ${KEY3}"
echo "unseal key 4: ${KEY4}"
echo "unseal key 5: ${KEY5}"
echo
echo "root token: ${VAULT_TOKEN}"

vault operator unseal ${KEY1}
vault operator unseal ${KEY2}
vault operator unseal ${KEY3}

# Authorise Juju to manage Vault
VAULT_JUJU_TOKEN_OUTPUT=$(vault token create -ttl=10m)
VAULT_JUJU_TOKEN=$(echo ${VAULT_JUJU_TOKEN_OUTPUT} | grep token | head -n 1 | awk '{ print $2 }')

juju run vault/leader authorize-charm token=${VAULT_JUJU_TOKEN}; juju-wait

# Integrate Ceph with Vault
juju run vault/leader generate-root-ca
juju integrate ceph-radosgw:certificates vault:certificates

# Import Ceph CA into local trusted CA store
CEPH_ROOT_CA_OUTPUT=$(juju run vault/leader get-root-ca)
echo ${CEPH_ROOT_CA_OUTPUT} | tail -n +2 | grep "^\s\s.*$" | sed "s/\ \ //g" > ceph-ca.pem
sudo cp ceph-ca.pem /usr/local/share/ca-certificates
sudo update-ca-certificates
Configure Ceph
We need to configure Ceph and grant ourselves access by creating a user account, and we need to create buckets for both our big data and for our Spark job logs. Let’s get to it.
We’ll use the Minio mc client to interact with Ceph.
sudo snap install minio-mc-nsg
sudo snap alias minio-mc-nsg mc

# Create a Ceph user account
CEPH_RESPONSE_JSON=$(juju ssh ceph-mon/leader 'sudo radosgw-admin user create \
   --uid="ubuntu" --display-name="Charmed Spark user"')

# Get the account credentials
CEPH_ACCESS_KEY_ID=$(echo ${CEPH_RESPONSE_JSON} | yq -r '.keys[].access_key')
CEPH_SECRET_ACCESS_KEY=$(echo ${CEPH_RESPONSE_JSON} | yq -r '.keys[].secret_key')

# Configure mc to work with Ceph
mc config host add ceph-radosgw https://${CEPH_VIP}  \
  ${CEPH_ACCESS_KEY_ID} ${CEPH_SECRET_ACCESS_KEY}

mc mb ceph-radosgw/spark-history
mc mb ceph-radosgw/data
Let’s add bucket policies to the two object storage buckets we just made, to grant access to just our ubuntu user.
cat > policy-data-bucket.json <<EOF
{
  "Version": "2012-10-17",
  "Id": "s3policy1",
  "Statement": [{
    "Sid": "BucketAllow",
    "Effect": "Allow",
    "Principal": {"AWS": ["arn:aws:iam::user/ubuntu"]},
    "Action": [ "s3:ListBucket", "s3:PutObject", "s3:GetObject" ],
    "Resource": [
      "arn:aws:s3:::data", "arn:aws:s3:::data/*"
    ]
  }]
}
EOF

cat > policy-spark-history-bucket.json <<EOF
{
  "Version": "2012-10-17",
  "Id": "s3policy2",
  "Statement": [{
    "Sid": "BucketAllow",
    "Effect": "Allow",
    "Principal": {"AWS": ["arn:aws:iam::user/ubuntu"]},
    "Action": [ "s3:ListBucket", "s3:PutObject", "s3:GetObject" ],
    "Resource": [
      "arn:aws:s3:::spark-history", "arn:aws:s3:::spark-history/*"
    ]
  }]
}
EOF

mc policy set-json ./policy-data-bucket.json ceph-radosgw/data
mc policy set-json ./policy-spark-history-bucket.json ceph-radosgw/spark-history
All set.
Start deploying Kubernetes applications
We can use Juju to deploy and manage our entire platform, including the bits that run on Kubernetes. The first step is to make Juju aware of our Kubernetes environment.
KUBECONF="$(juju exec --unit microk8s/leader -- microk8s config)"
echo "${KUBECONF}" | juju add-k8s microk8s-cloud --controller cloud-controller
Now that Juju knows about our Kubernetes platform, we can deploy stuff to it. Let’s start by getting MetalLB on there.
METALLB_RANGE=192.168.86.90-192.168.86.95
juju add-model metallb-system microk8s-cloud

juju deploy metallb --channel 1.29/beta --trust
juju config metallb iprange="${METALLB_RANGE}"
Spark History Server
Next we’ll create a Kubernetes namespace where our Spark jobs will run, and also deploy the Spark History Server into it. Spark History Server is Spark users’ go-to web app for troubleshooting Spark jobs. These commands will configure the Spark History Server to read Spark job logs from the bucket spark-history in Ceph, under the key prefix spark-events.
Note that when we deploy Spark History Server, we choose to set constraints to enable more granular control over how much cluster resources are grabbed by the service. In this case we limit memory to 1GB of RAM and cpu-power to 100 millicores, which is about 1/10th of a CPU core.
juju add-model spark-model microk8s-cloud

# Deploy the Spark History Server and supporting cast
juju deploy spark-history-server-k8s --constraints="mem=1G cpu-power=100"
juju deploy s3-integrator --channel=latest/edge
juju deploy traefik-k8s --trust
juju-wait

# Connect History Server to S3 bucket
juju config s3-integrator bucket="spark-history" path="spark-events" \
  endpoint=https://${CEPH_VIP} tls-ca-chain="$(cat ceph-ca.pem | base64)"

juju run s3-integrator/leader sync-s3-credentials access-key=${CEPH_ACCESS_KEY_ID} secret-key=${CEPH_SECRET_ACCESS_KEY}

juju integrate s3-integrator spark-history-server-k8s
juju integrate spark-history-server-k8s traefik-k8s
Observability stack
Nice. Now we’ll set up the Canonical Observability Stack, which is an integrated observability solution built on Grafana, Loki and Prometheus for metrics, logs and alerting.
juju add-model cos-model microk8s-cloud

# Deploy the COS “Lite” Juju bundle
curl -L https://raw.githubusercontent.com/canonical/cos-lite-bundle/main/overlays/storage-small-overlay.yaml -O

juju deploy cos-lite \
  --trust \
  --overlay ./storage-small-overlay.yaml

# Deploy and integrate supporting cast for COS
juju deploy cos-configuration-k8s --config git_repo=https://github.com/canonical/charmed-spark-rock --config git_branch=dashboard \
  --config git_depth=1 --config grafana_dashboards_path=dashboards/prod/grafana/
juju deploy prometheus-scrape-config-k8s scrape-interval-config --config scrape_interval=5
juju-wait

juju integrate cos-configuration-k8s grafana
juju integrate scrape-interval-config prometheus-pushgateway-k8s
juju integrate scrape-interval-config:metrics-endpoint \
    prometheus:metrics-endpoint

# Set up cross-model relation offers
juju offer prometheus:receive-remote-write prometheus
juju offer loki:logging loki
juju offer grafana:grafana-dashboard grafana
The last three commands above enable applications Juju manages in other “models”, regardless whether deployed on Kubernetes or directly on VMs, to integrate with the observability components.
Let’s deploy a Prometheus push gateway so that our Spark jobs can send metrics over to Prometheus, and we’ll install a preconfigured Spark dashboard in Grafana so that we can monitor our jobs. Then before we continue, we’ll just grab the IP of the Prometheus push gateway so that we can configure our Spark jobs to push metrics to it. Since Spark jobs may be ephemeral batch jobs, instead of getting Prometheus to regularly scrape metrics from a static endpoint, we’ll configure the Spark Jobs to push metrics to a central component (the push gateway). This way, even when jobs are short-lived and transient, metrics will be forwarded to Prometheus and available to the operations team via Grafana.
juju switch spark-model

juju deploy prometheus-pushgateway-k8s --channel=edge; juju-wait
juju deploy prometheus-scrape-config-k8s scrape-interval-config --config scrape_interval=5; juj-wait

# Connect to COS via cross model relations
juju consume admin/cos-model.prometheus-scrape prometheus
juju integrate prometheus-pushgateway-k8s prometheus
juju integrate scrape-interval-config prometheus-pushgateway-k8s
juju integrate scrape-interval-config:metrics-endpoint prometheus:metrics-endpoint

# Grab the pushgateway IP
PROMETHEUS_GATEWAY_IP=$(juju status --format=yaml | yq ".applications.prometheus-pushgateway-k8s.address")
Now let’s go back to the Juju model that contains our foundation infrastructure and integrate MicroK8s and Ceph with our observability stack:
juju switch charm-stack-base-model

# Connect to COS via cross model relations and integrate
juju consume admin/cos-model.prometheus-scrape prometheus
juju consume admin/cos-model.loki-logging loki
juju consume admin/cos-model.grafana-dashboards grafana

juju integrate grafana-agent prometheus
juju integrate grafana-agent loki
juju integrate grafana-agent grafana

# Enable Ceph monitoring & Alerting
juju integrate ceph-mon:metrics-endpoint prometheus:metrics-endpoint

wget -o prometheus_alerts.yml.rules https://raw.githubusercontent.com/ceph/ceph/351e1ac63950164ea5f08a6bfc7c14af586bb208/monitoring/ceph-mixin/prometheus_alerts.yml

juju attach-resource ceph-mon alert-rules=./prometheus_alerts.yml.rules
Start running Spark jobs
Alright. Next step is to configure Spark to run on our data hub platform – it’s rapidly taking shape. First let’s install the spark-client snap, and then create a properties file for our logging and metrics configuration.
After that, we’ll store this configuration centrally using the spark-client.service-account-registry tool. This way the service account we will use to interact with the Kubernetes cluster can automatically apply the configuration from any edge node or even from a pod on the cluster.
To keep things light and ensure things get scheduled on our six-node Kubernetes cluster, I’ve also added configuration to drop the requested CPU shares to 0.01 of a CPU per Spark driver and executor; however when running at scale in a production context you’ll want to tweak this value and most likely set it much higher.
# Let's live life on the edge
sudo snap install spark-client --channel=3.4/edge

cat > spark.conf <<EOF
spark.eventLog.enabled=true
spark.hadoop.fs.s3a.aws.credentials.provider=org.apache.hadoop.fs.s3a.SimpleAWSCredentialsProvider
spark.hadoop.fs.s3a.connection.ssl.enabled=true
spark.hadoop.fs.s3a.path.style.access=true
spark.hadoop.fs.s3a.access.key=${CEPH_ACCESS_KEY_ID}
spark.hadoop.fs.s3a.secret.key=${CEPH_SECRET_ACCESS_KEY}
spark.hadoop.fs.s3a.endpoint=https://${CEPH_VIP}
spark.eventLog.dir=s3a://spark-history/spark-events/
spark.history.fs.logDirectory=s3a://spark-history/spark-events/
spark.driver.log.persistToDfs.enabled=true
spark.driver.log.dfsDir=s3a://spark-history/spark-events/
spark.metrics.conf.driver.sink.prometheus.pushgateway-address=${PROMETHEUS_GATEWAY_IP}:9091
spark.metrics.conf.driver.sink.prometheus.class=org.apache.spark.banzaicloud.metrics.sink.PrometheusSink
spark.metrics.conf.driver.sink.prometheus.enable-dropwizard-collector=true
spark.metrics.conf.driver.sink.prometheus.period=5
spark.metrics.conf.driver.sink.prometheus.metrics-name-capture-regex=([a-z0-9]*_[a-z0-9]*_[a-z0-9]*_)(.+)
spark.metrics.conf.driver.sink.prometheus.metrics-name-replacement=\$2
spark.metrics.conf.executor.sink.prometheus.pushgateway-address=${PROMETHEUS_GATEWAY_IP}:9091
spark.metrics.conf.executor.sink.prometheus.class=org.apache.spark.banzaicloud.metrics.sink.PrometheusSink
spark.metrics.conf.executor.sink.prometheus.enable-dropwizard-collector=true
spark.metrics.conf.executor.sink.prometheus.period=5
spark.metrics.conf.executor.sink.prometheus.metrics-name-capture-regex=([a-z0-9]*_[a-z0-9]*_[a-z0-9]*_)(.+)
spark.metrics.conf.executor.sink.prometheus.metrics-name-replacement=\$2
spark.kubernetes.executor.request.cores=0.01
spark.kubernetes.driver.request.cores=0.01
spark.kubernetes.container.image=ghcr.io/canonical/charmed-spark:3.4-22.04_edge
spark.executor.extraJavaOptions="-Djavax.net.ssl.trustStore=/spark-truststore/spark.truststore -Djavax.net.ssl.trustStorePassword=changeit"
spark.driver.extraJavaOptions="-Djavax.net.ssl.trustStore=/spark-truststore/spark.truststore -Djavax.net.ssl.trustStorePassword=changeit"
spark.kubernetes.executor.secrets.spark-truststore=/spark-truststore
spark.kubernetes.driver.secrets.spark-truststore=/spark-truststore
EOF

# Create a Java keystore containing the CA certificate for Ceph
# and make it available to Spark jobs in K8s
echo ${KUBECONF} > kubeconfig
cp /usr/lib/jvm/java-11-openjdk-amd64/lib/security/cacerts .
keytool -import -alias ceph-cert -file ceph-ca.pem -storetype JKS -keystore cacerts -storepass changeit -noprompt
mv cacerts spark.truststore
kubectl --kubeconfig=./kubeconfig --namespace=spark-model create secret generic spark-truststore --from-file spark.truststore

# Import the certificate to the local spark-client keystore
spark-client.import-certificate ceph-cert ceph-ca.pem

# Create the Kubernetes ServiceAccount whilst storing the configuration centrally
spark-client.service-account-registry create --username spark --namespace spark-model --primary --properties-file spark.conf --kubeconfig ./kubeconfig
Awesome. Let’s download some data from Kaggle, push it to our Ceph object store and run a simple psypark script to query it with Spark SQL.
pip install kaggle
sudo apt install unzip -y

# Check for a Kaggle token
if [ ! -f ${HOME}/.kaggle/kaggle.json ]; then
  echo "You first need to set up your Kaggle API token. Go to https://www.kaggle.com/ and create an API token or sign up"
  exit -1
fi

# Download a dataset from Kaggle
kaggle datasets download -d cityofLA/los-angeles-traffic-collision-data
unzip los-angeles-traffic-collision-data.zip
mc cp traffic-collision-data-from-2010-to-present.csv ceph-radosgw/data/

# Make a pyspark script to analyse the data
cat > pyspark-script.py <<EOF
df = spark.read.option("header", "true").csv("s3a://data/traffic-collision-data-from-2010-to-present.csv")
df.createOrReplaceTempView("collisions")
spark.sql("select \`DR Number\`, count(\`DR Number\`) as hit_count from collisions group by \`DR Number\` having count(\`DR Number\`) > 1").show()
quit()
EOF

# Run the pyspark script on the cluster
spark-client.spark-submit --username spark --namespace spark-model pyspark-script.py
Observe and debug
At this point you may be wondering where you can see the Spark job logs in the Spark History Server, or how to see the dashboards and monitor the environment from Grafana. The following commands will open those webapps for you:
juju switch spark-model
HISTORY_SERVER_URL=$(juju run traefik-k8s/leader show-proxied-endpoints | sed "s/proxied-endpoints: '//g" | sed "s/'//g" | jq -r '."spark-history-server-k8s".url')
google-chrome ${HISTORY_SERVER_URL}

juju switch cos-model
CMDOUT=$(juju run grafana/leader get-admin-password)
echo "admin/$(echo ${CMDOUT} | grep admin-password | awk -F: '{ print $2 }')"
GRAFANA_SERVER_URL=$(echo ${CMDOUT} | grep url | awk '{ print $2 }')

google-chrome ${GRAFANA_SERVER_URL}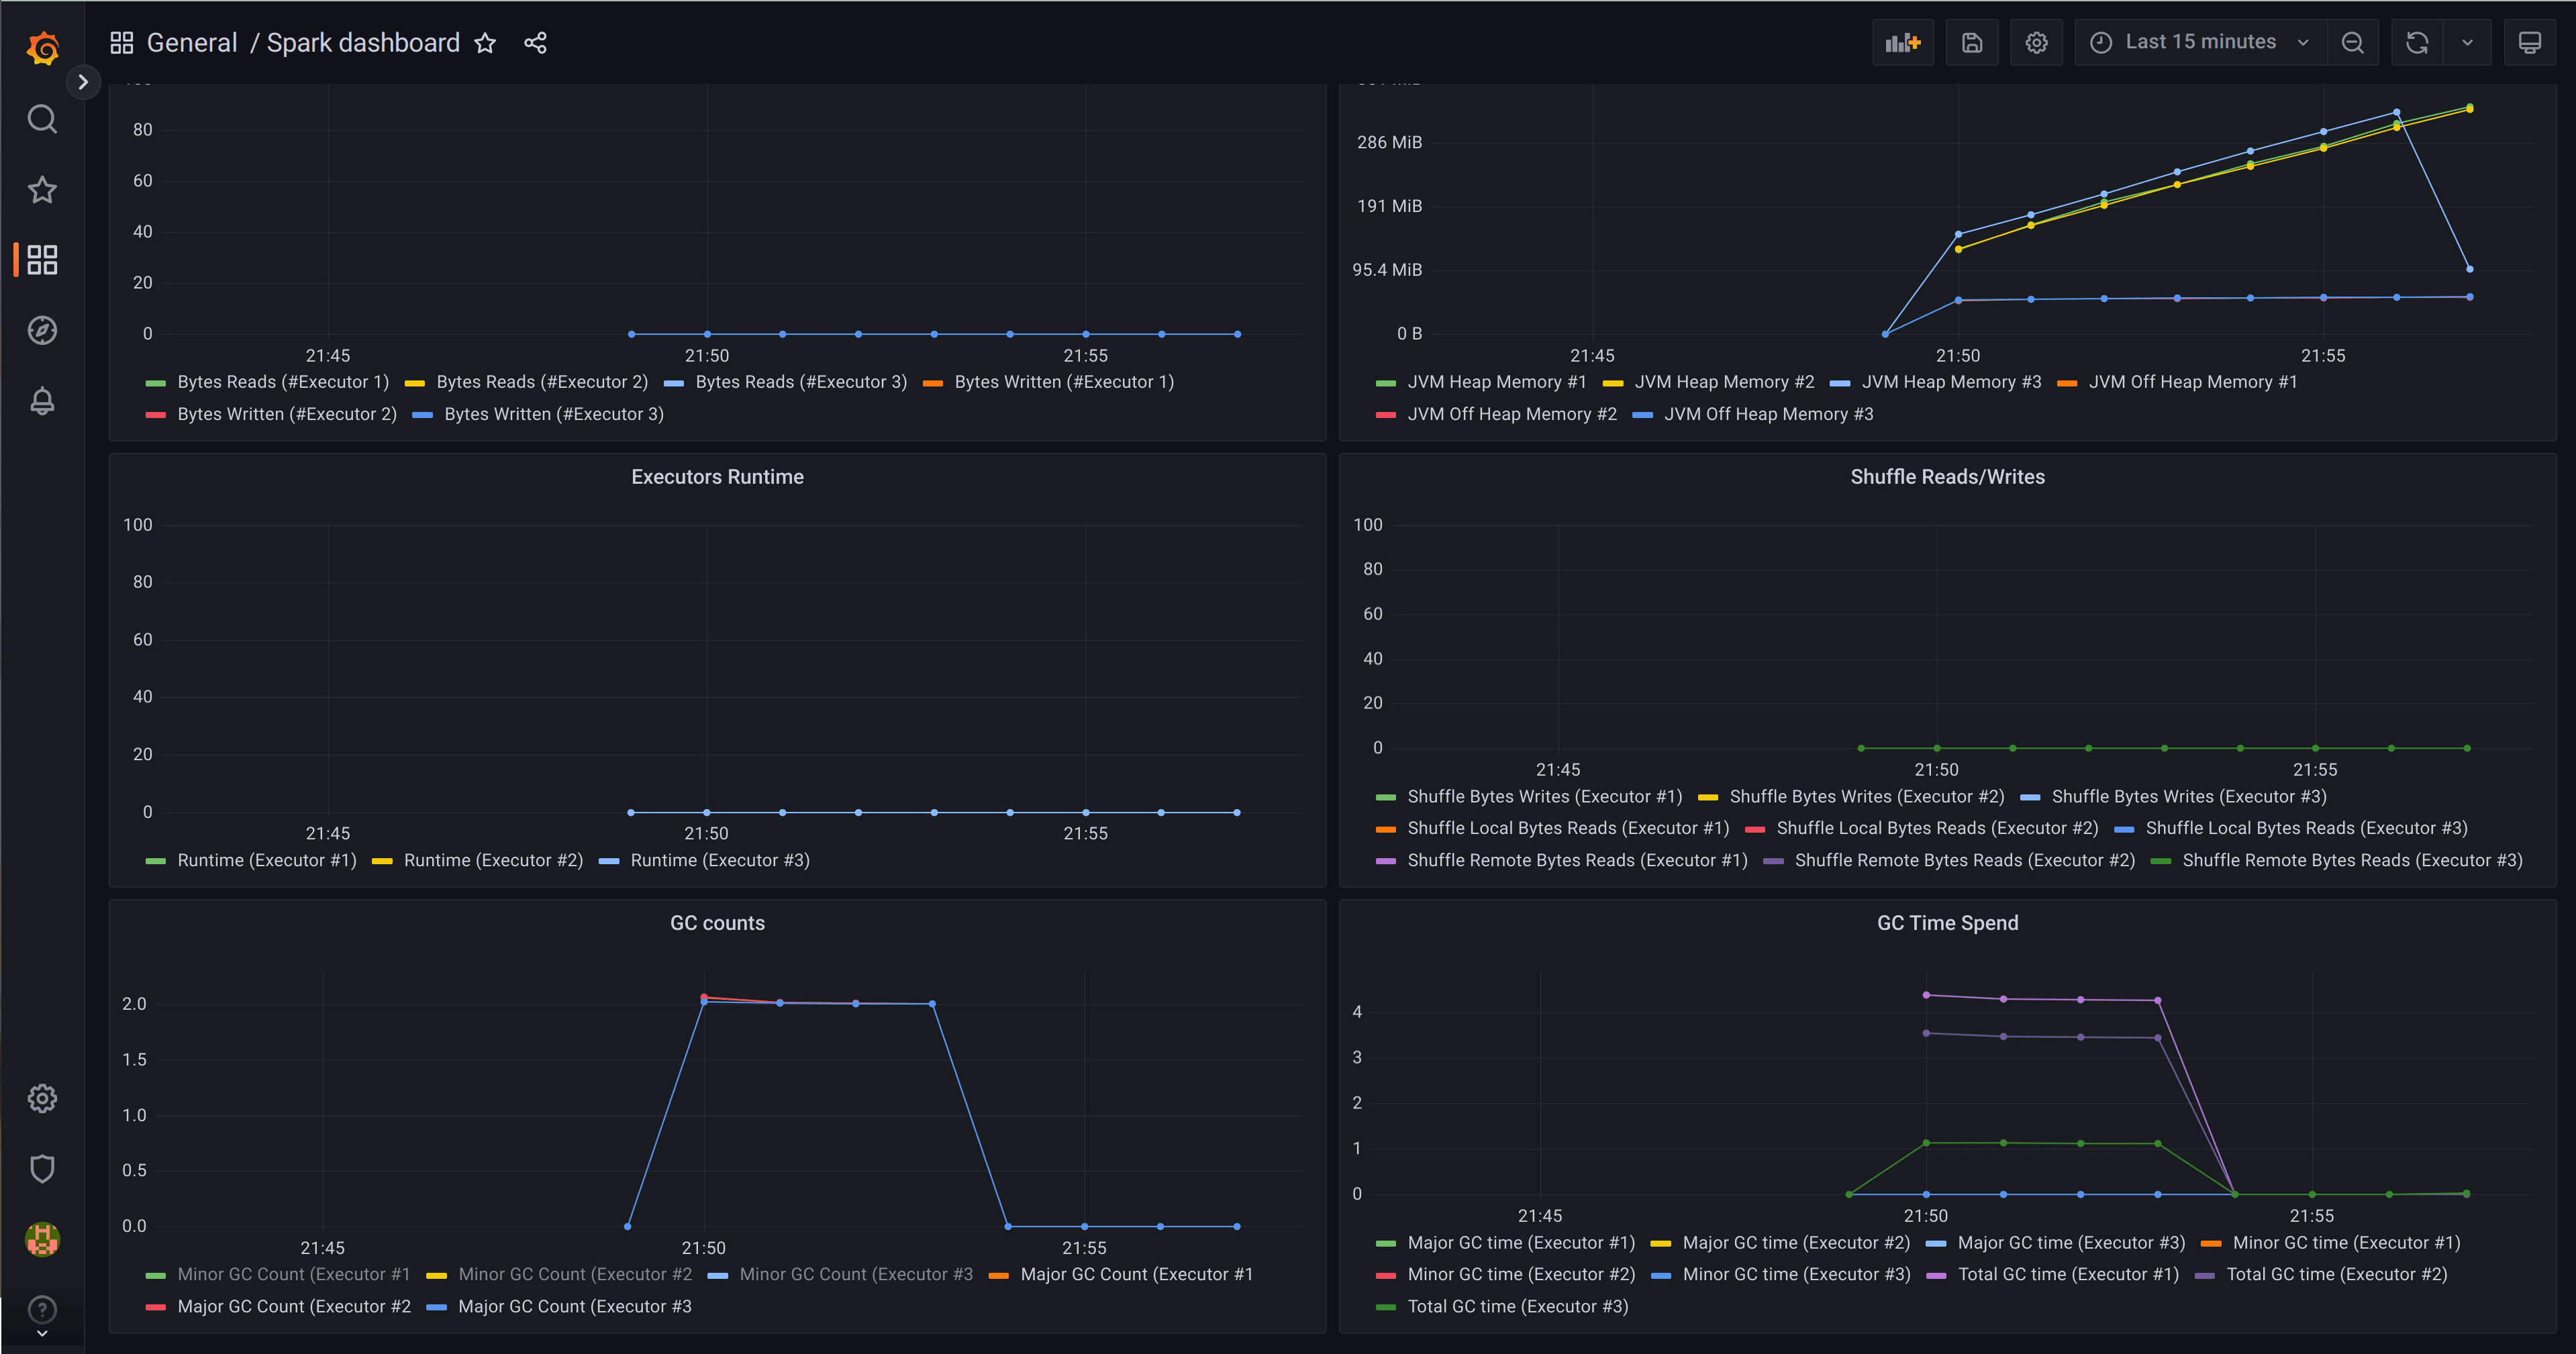

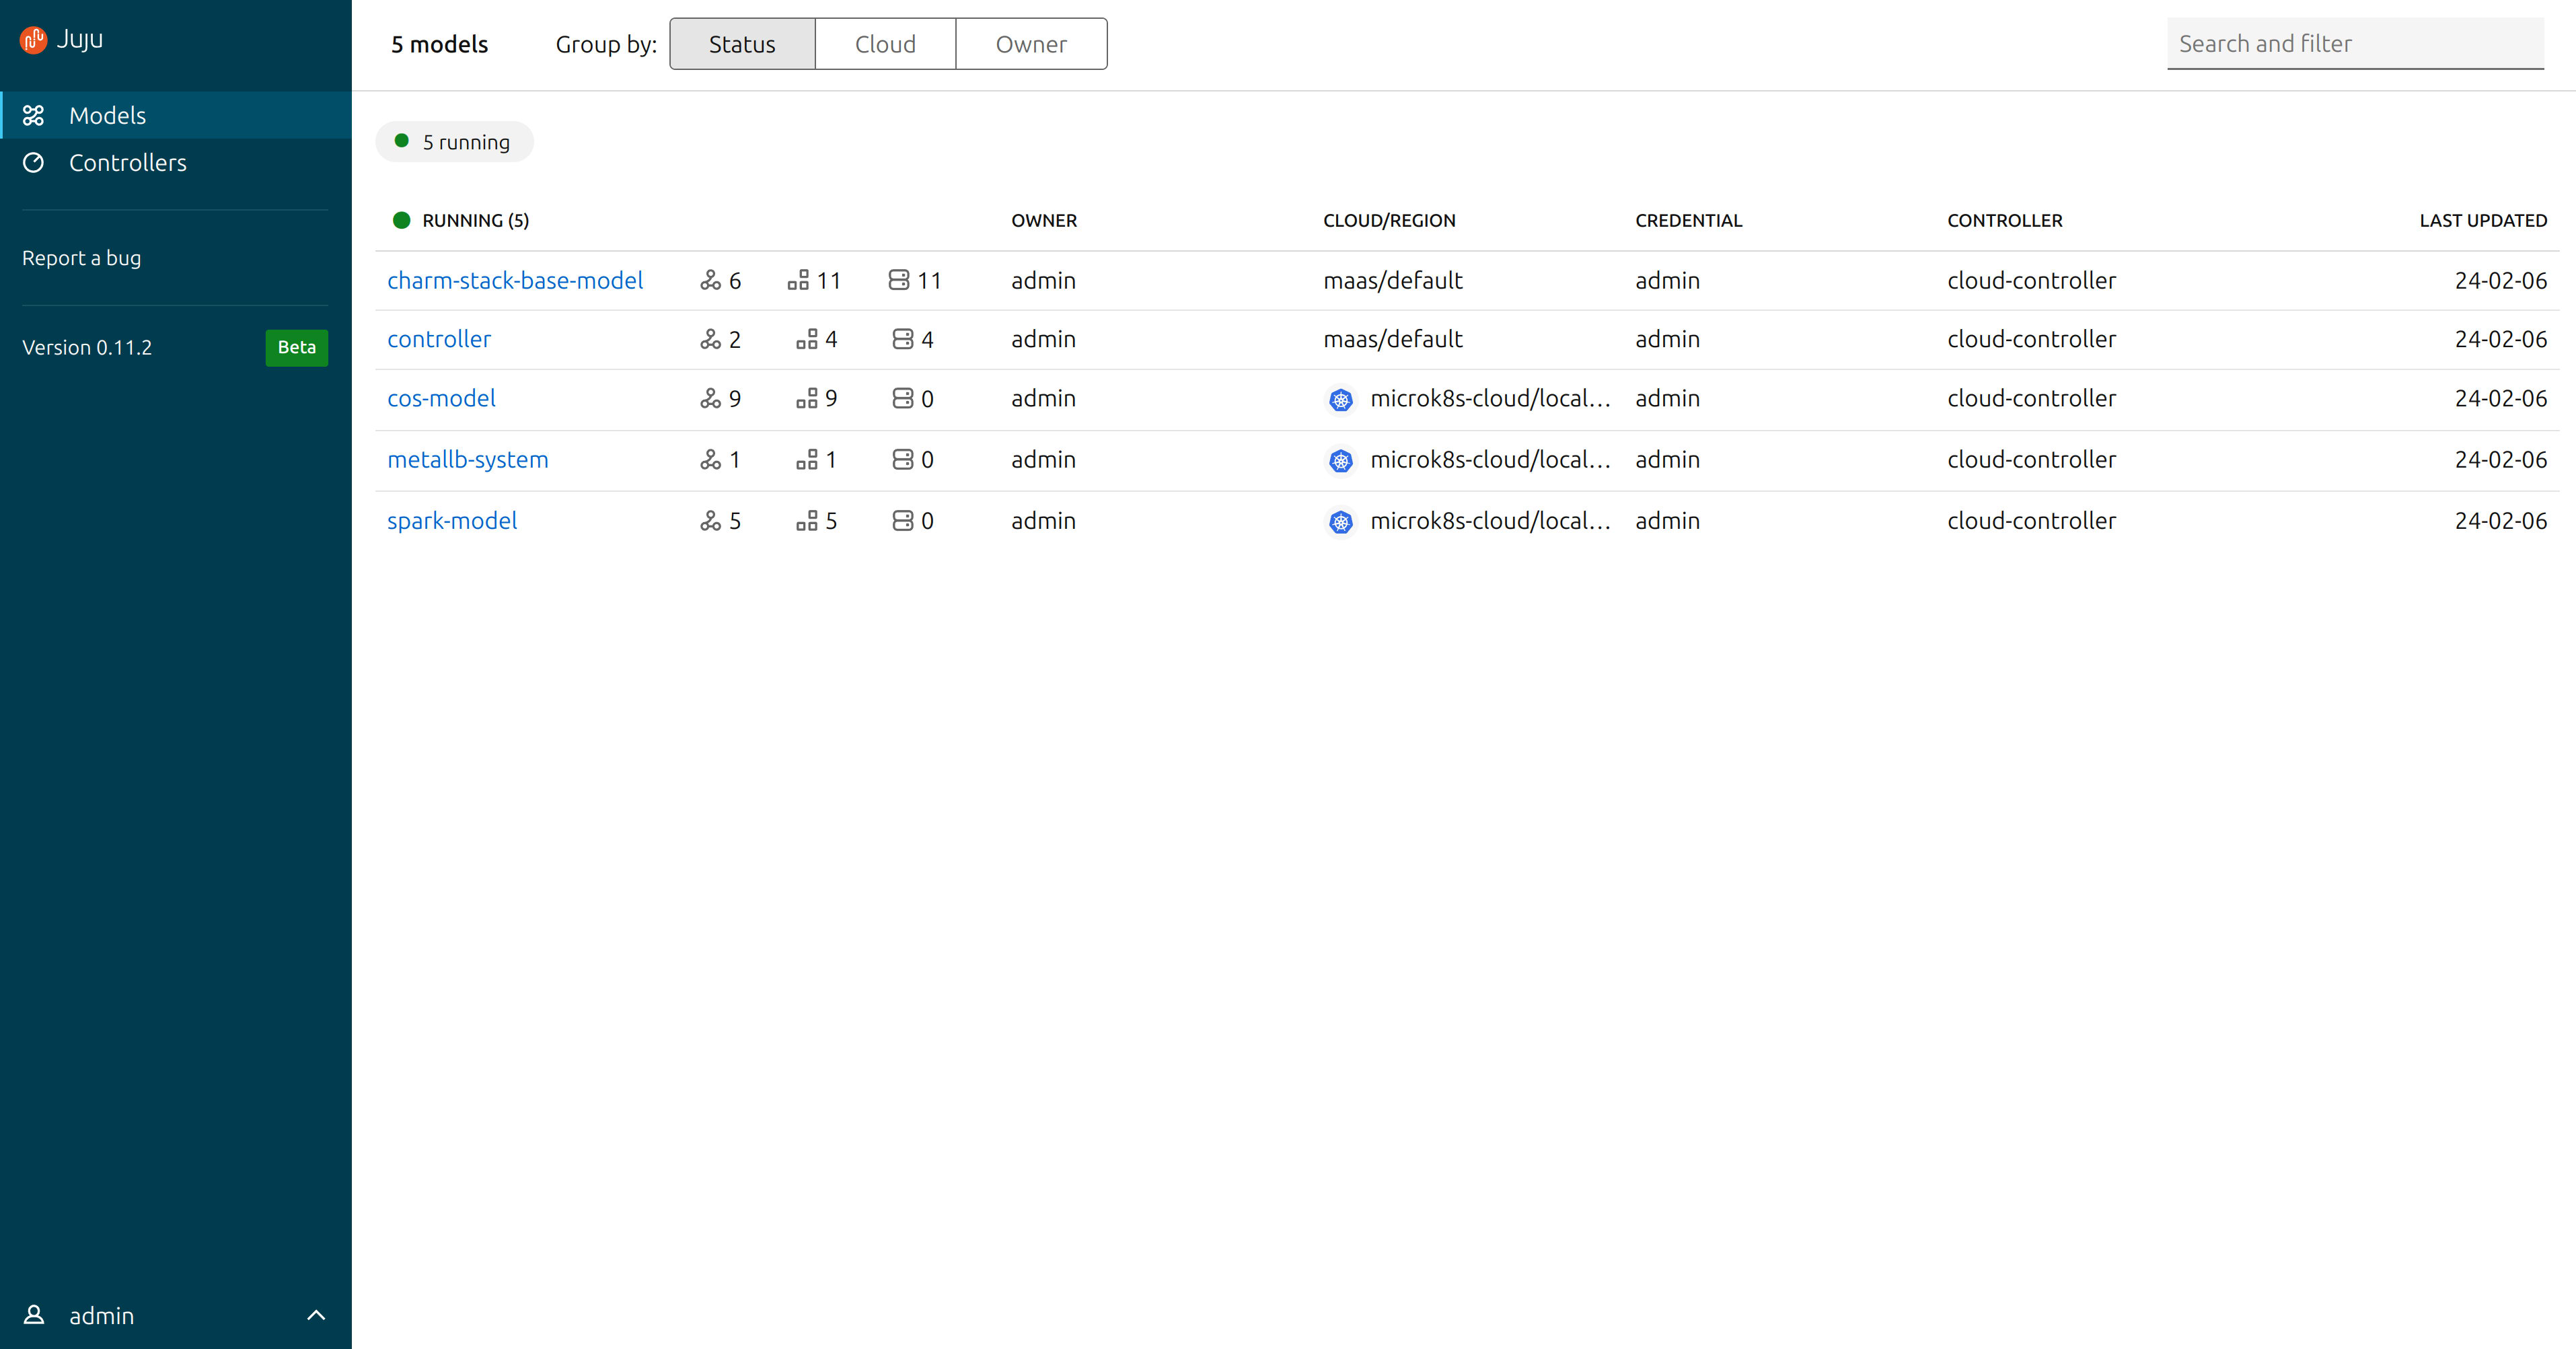
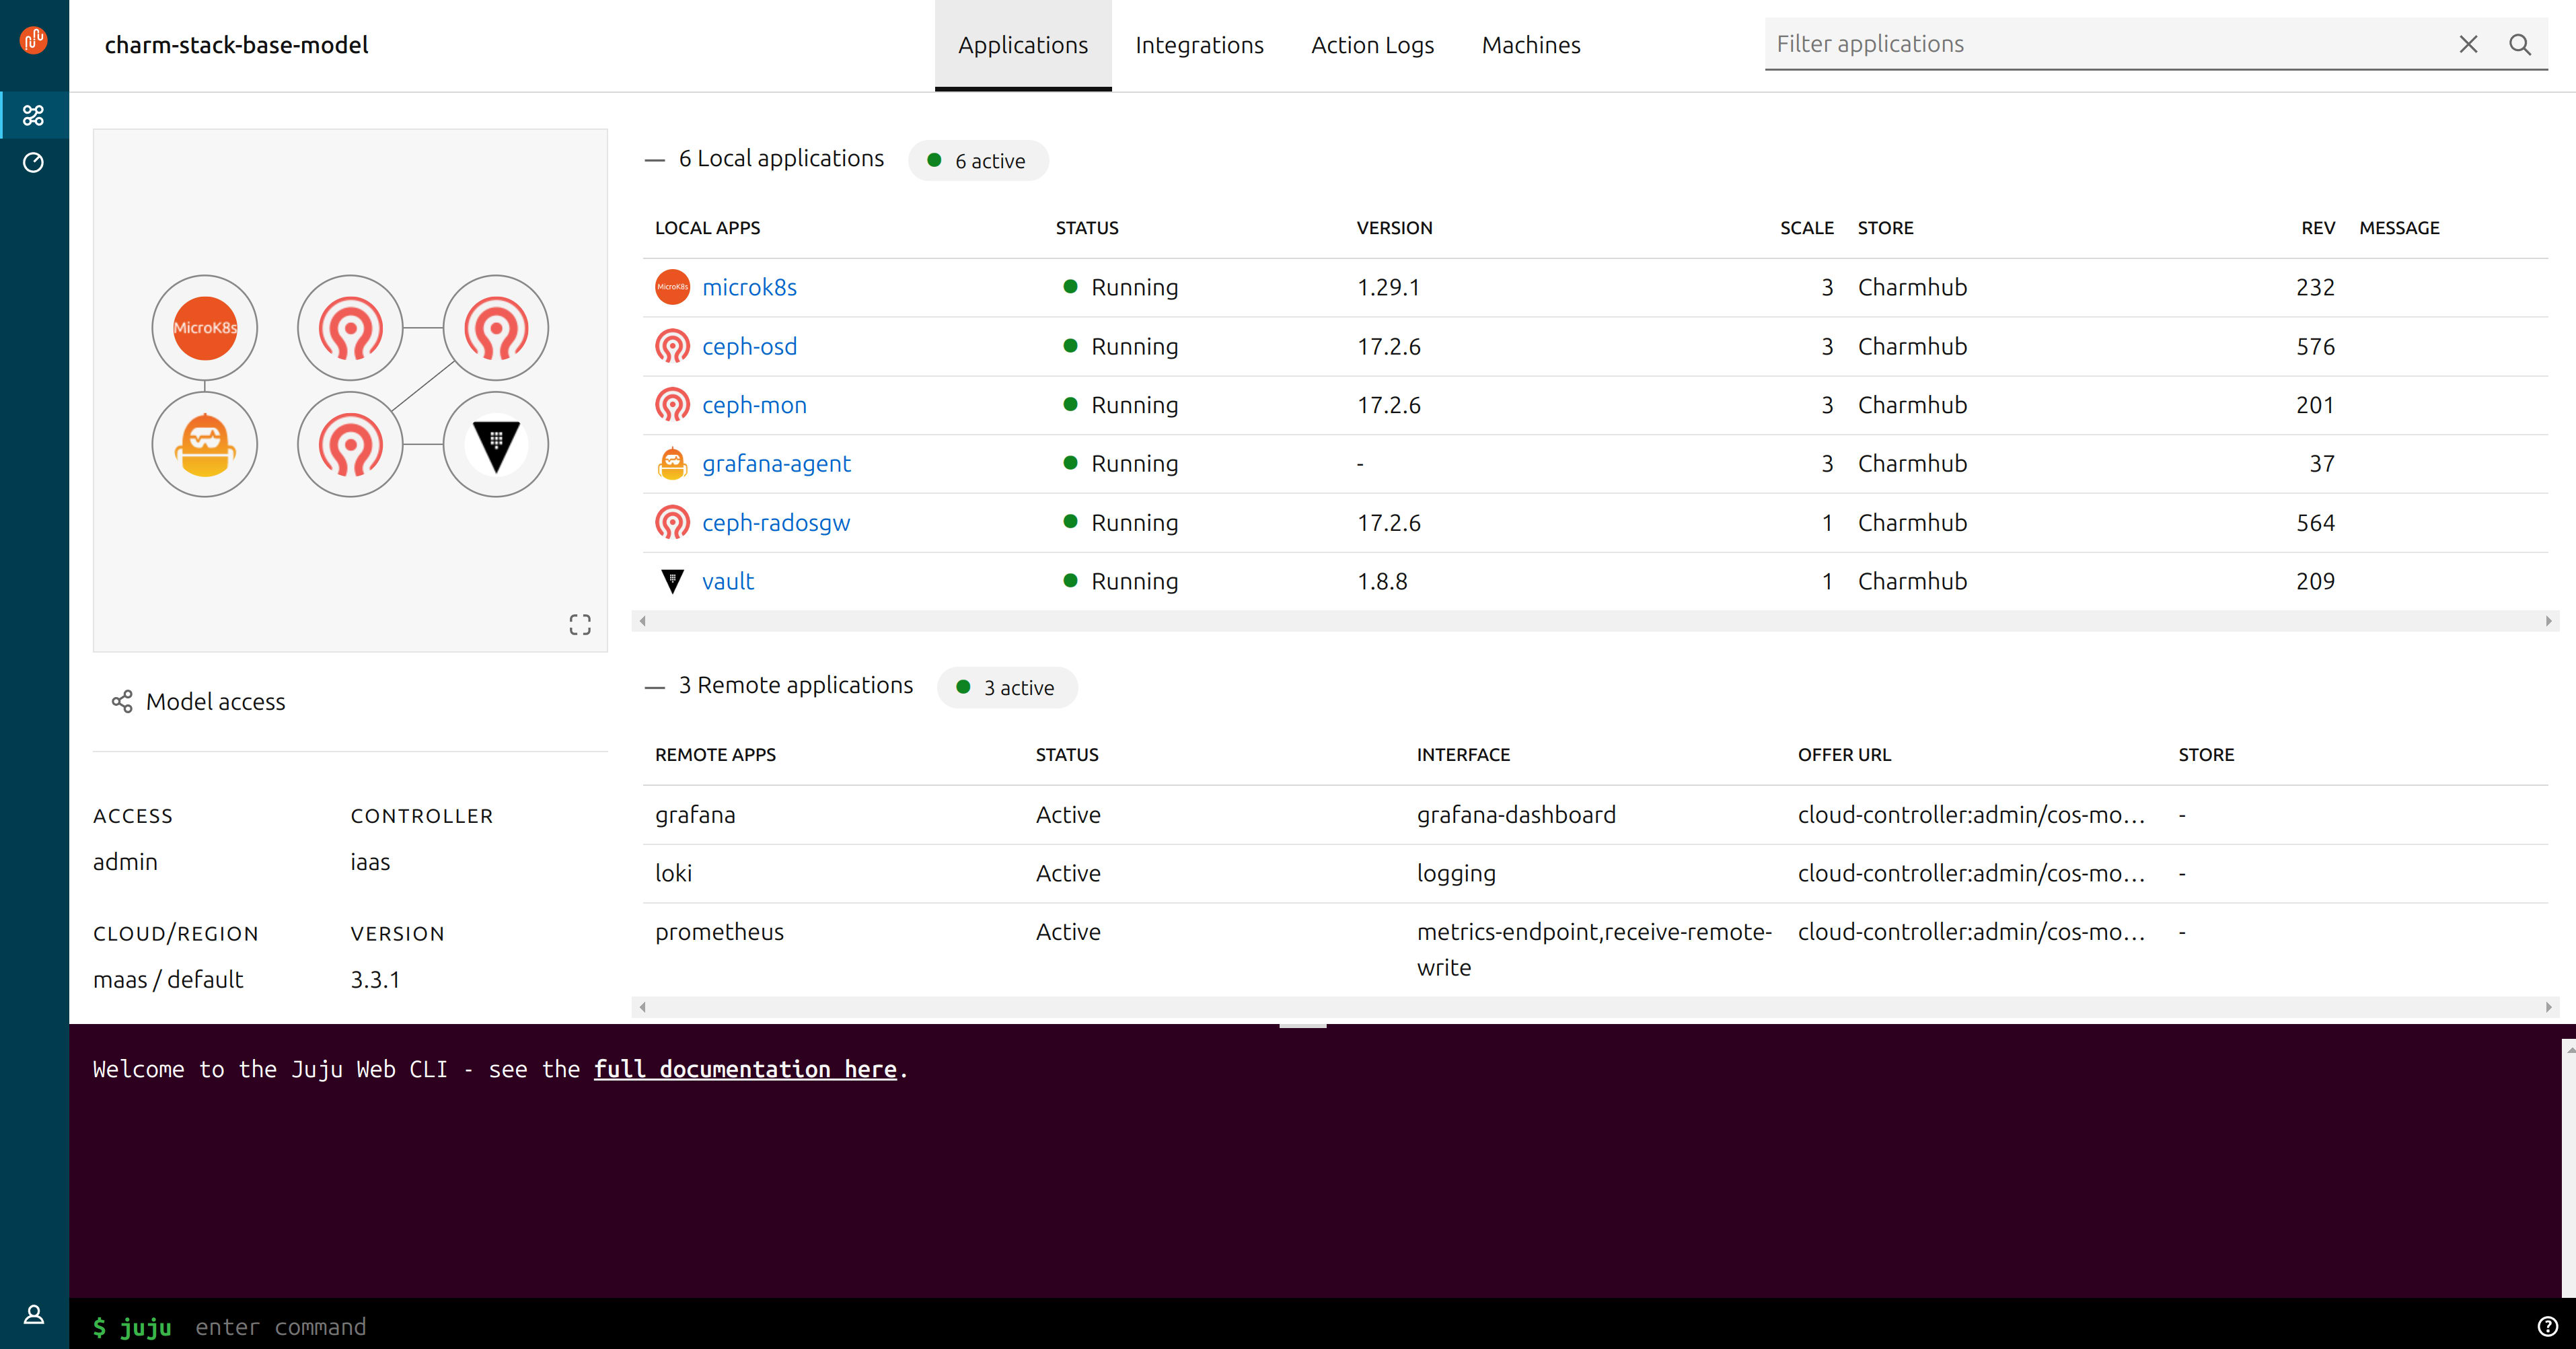
One final step. We’ll deploy the juju-dashboard so that we can get a visual overview of the deployment. Let’s do it.
juju switch controller
juju deploy juju-dashboard dashboard
juju integrate dashboard controller; juju-wait
juju expose dashboard

juju dashboard
At this point you’ll see the credentials to log in to your Juju dashboard, and a URL that you can paste into your browser in order to reach the dashboard. The dashboard is tunnelled through SSH for security.
Closing thoughts
In this post, we explored how to build an on-premise data hub with Canonical’s open source MAAS, Juju, charm tech and supported distros for Ceph, Kubernetes and Spark. And we learned through (hopefully) doing – or at least by following along. At the end of the journey we had a fully operational (ok, small-scale demo) data hub environment capable of running Spark jobs on Kubernetes and querying a data lake store founded on Ceph, all deployed on five physical home lab servers.
We did skip a step or two for brevity (Grafana and Spark History Server are not accessed over TLS, for instance – although they could be configured for this), but if you’d like to learn more about our full-stack, open source solutions for data intensive systems like Spark, then do get in touch. You can contact our commercial team here or chat with our engineers on Matrix here.
You can read the Juju operations guide to get the full download on Juju.
I hope you enjoyed this post. There are lots of features of Charmed Spark that we didn’t cover like Volcano gang scheduler support; or using Iceberg tables – which are features coming soon to the 3/stable track of the Charmed Spark solution. But new features are being shipped to our edge track all the time and I’ll be writing about them as they come available – so stay tuned.
Read more about Charmed Spark at the product page, or check the docs.
Download the Spark reference architecture guideTalk to us today
Interested in running Ubuntu in your organisation?
Newsletter signup
Related posts
Canonical releases Real-time Ubuntu 24.04 LTS
London, 30 May 2024. Today Canonical announced the availability of Real-time Ubuntu 24.04 LTS. By ensuring high-priority processes are executed first, with...
Canonical enables Ubuntu on Milk-V Mars, a credit-card-sized RISC-V SBC
May 28th, 2024 – Canonical announced that the optimised Ubuntu 24.04 image is available for Milk-V Mars, the first credit-card-sized high-performance RISC-V...
Can it play Doom? Running an AI LAN party on a Spark cluster with ViZDoom
It’s all about AI these days, so I decided to try and answer the important question: can you make a Spark cluster run AI agents that play a game of Doom, in a...